Justice Reinvestment in Kansas
Kansas, like many states, is facing a dire budget crisis amid the need for criminal justice system improvements. To preserve effective community supervision, programming, and treatment; reduce recidivism; and protect public safety, the state must avert significant costs to reinvest in these priorities.
As recently as April 2020, the Kansas budget was forecast to have a $653 million shortfall in fiscal year (FY) 2021. Before March 2020, Kansas Department of Corrections (KDOC) prisons were operating over 100 percent of capacity, and the prison population was projected to increase 14 percent by FY2029 at an estimated cost to the state of $209 million.1 Although the population in KDOC facilities had fallen to 82 percent of capacity by the end of July due to a dramatic reduction in admissions, this decrease will only be temporary without intervention, and pressures on the corrections system will continue to result in limited treatment and programming options.
While people sentenced to prison for violent offenses made up more than half of the state’s prison population in FY2019, a substantial portion (one-third) were there for violating the terms of their supervision (21 percent for probation violations and 12 percent for parole violations). And two-thirds of prison admissions that year were due to supervision violations, the majority of which were because of technical violations, such as failed drug tests or missed appointments. Further, as of September 2020, KDOC was still projecting that future prison population growth would be primarily driven by drug and nonviolent offenses and by supervision violations.
Due to staffing shortages and other capacity issues, KDOC has limited ability to provide programming, treatment, or education while people are incarcerated, which does little to mitigate the chances of recidivism. This means that people with substance use disorders are not necessarily getting treatment while in prison. Nor does it ensure that people who are returning to prison due to revocation are receiving cognitive behavioral treatment or programming. Additionally, most people leaving KDOC facilities need employment support, substance use and recovery programming, and/or mental health services, but communities throughout the state have varying capacities to meet these needs. With local and state budget cuts looming, the very existence of these programs and services, both in prisons and in the community, will be further jeopardized.
To address these challenges, the Kansas legislature established the Kansas Criminal Justice Reform Commission (“the Commission”) in 2019. In January 2020, Kansas leaders—Governor Laura Kelly, Attorney General Derek Schmidt, Chief Justice Marla Luckert, Senate President Susan Wagle, Speaker of the House Ron Ryckman, Kansas Department of Corrections Secretary Jeff Zmuda, Kansas Criminal Justice Reform Commission Chair and Sedgwick County District Attorney Marc Bennett, and Department of Aging and Disability Services and Children and Families Secretary Laura Howard—took additional action by requesting support from the U.S. Department of Justice’s Bureau of Justice Assistance (BJA) and The Pew Charitable Trusts (Pew) to utilize a Justice Reinvestment approach to address system challenges. BJA and Pew approved Kansas state leaders’ request and asked The Council of State Governments (CSG) Justice Center to partner with state leaders to collect and analyze state data and assist in developing appropriate policy recommendations that prioritize corrections spending on effective recidivism-reduction strategies.
This overview highlights some recent criminal justice trends in Kansas. Information presented here is based on Kansas statutes, publicly available reports from Kansas state agencies, publicly available reports from federal agencies, and preliminary analysis of case-level data provided by the state and analyzed by CSG Justice Center staff.
Criminal Justice System Trends in Kansas
Kansas prison population projections are rapidly changing, and current data is showing new disruptions in previous trend lines. Kansas state leaders will need to carefully monitor growth to ensure appropriate management of facility capacity and allocation of resources.
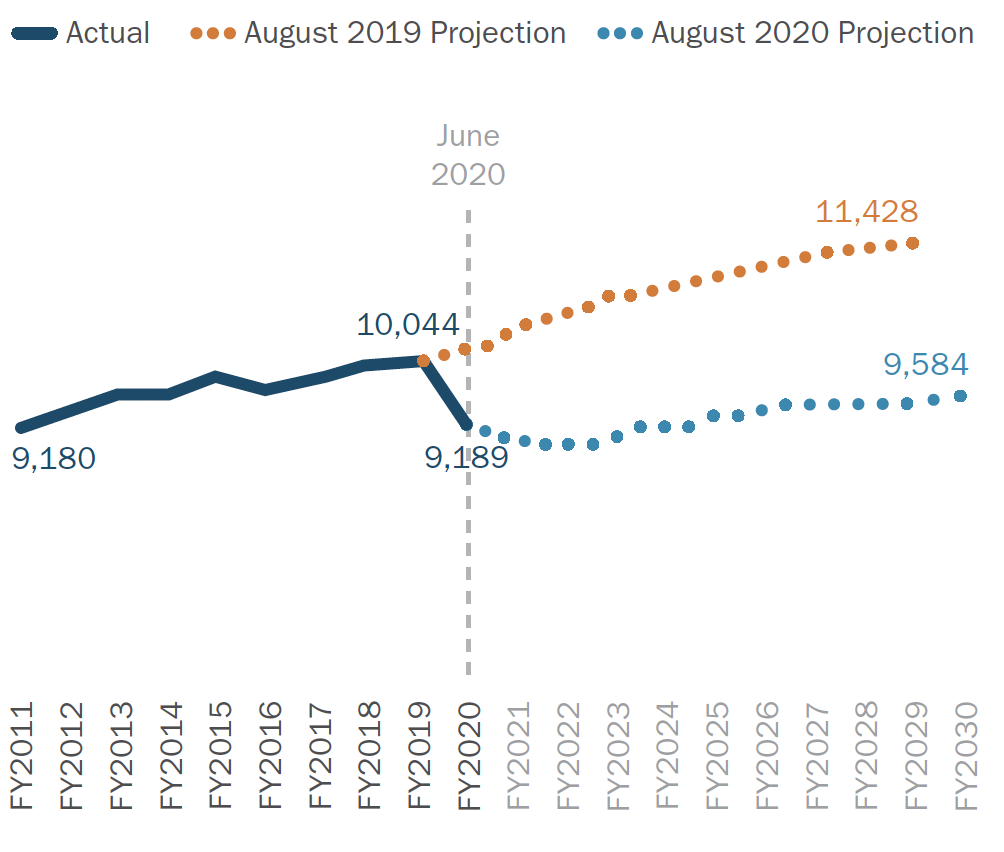
- At the end of FY2019, KDOC was operating at 101 percent of capacity, creating overcrowded prison conditions and persistent staffing challenges.2 Kansas’s prison population increased 13 percent between FY2010 and FY2019 and was projected to grow another 14 percent (1,384 people) by FY2029.3 (See Figure 1.) In August 2020, the Kansas Sentencing Commission released adjusted prison projections through FY2030 that took into account the dramatic reductions after March 2020.
- The previously projected prison population growth was driven by anticipated increases in people being sentenced for violent, nonviolent, and drug offenses—523 (9-percent increase), 369 (41 percent), and 384 (24 percent) people, respectively, by FY2029. The number of people incarcerated for violations of supervision conditions was also projected to grow by 345 people (21-percent increase) by FY2029.4
- In FY2019, 168 people were sentenced to prison despite being eligible for probation based on their criminal record and offense.5
- Between FY2010 and FY2019, about a quarter of admissions to prison were for violent offenses, and slightly over half of the people in prison at the end of each year were serving a sentence for a violent offense.6
Figure 1. Kansas Actual and Projected Prison Population at Fiscal Year End, FY2011–FY20307
Violent crime has increased across the state in recent years.
- The number of reported violent crimes in Kansas rose 22 percent from 2010 to 2019, driven by an increase in aggravated assaults.8
- Kansas had the 14th-largest violent crime rate increase in the nation between 2010 and 2019.9
- While the majority of violent crime in Kansas occurs in population centers, violent crime has increased across the state. All of the 10 counties where the violent crime rate doubled between 2010 and 2019 had fewer than 10,000 residents.10 Though the total number of violent crimes in these areas is relatively low, this increase presents unique challenges for the rural and frontier regions of the state. For example, in Cloud County, violent crime increased from 24 to 59 incidents during this time.11
- The number of domestic violence homicides in Kansas increased 16 percent from 2010 to 2018, from 32 to Of the 146 reported homicides in Kansas in 2018, 25 percent were domestic violence related.12
Increases in prison sentences for drug offenses have been driving growth in the prison population.
- From 2010 to 2018, total reported arrests decreased 40 percent, while arrests for drug offenses increased 19 percent.13
- From FY2010 to FY2019, the number of felony drug cases filed in district court increased 125 percent; and the proportion of felony drug cases filed in district court, out of all felony filings, increased from 13 to 27 percent.14 During this time,
- Community Corrections starts for felony drug offenses increased 52 percent;15
- The number of women starting Community Corrections for felony drug offenses increased 91 percent; 16
- Felony sentences for drug offenses overall increased 51 percent;17
- Sentences to prison for drug offenses increased 33 percent;18 and
- The average prison sentence length for drug offenses increased from 35 to 42 months.19
Sending people to prison for community supervision20 sanctions, violations, and revocations has historically contributed substantially to prison population pressures in Kansas.
- In FY2019, two-thirds of prison admissions and one-third of the year-end prison population were due to supervision sanctions and revocations.21
- At the end of FY2019, there were nearly 24,000 people on probation in Kansas (8,284 supervised by Community Corrections for felony offenses and 15,611 supervised by Court Services, 4,796 of which were for felony offenses)22 and over 7,000 people on parole or post-incarceration supervision.23
- In the same year, 992 people were revoked from Community Corrections for condition violations only. The most common violations committed by this group of people, including the violation they were revoked for, were failure to report/absconding (79 percent of people revoked had at least one violation of this type); missed or positive urinalysis/alcohol test (76 percent); failure to pay costs (69 percent); and failure to attend treatment (43 percent). Just over half (525, or 53 percent) of these people did not have even one hearing prior to the hearing that resulted in a revocation.24
Kansas’s female prison population has grown disproportionately in recent years.
- Between FY2010 and FY2019, the number of women in prison in Kansas increased 53 percent, from 602 to 921. During the same period, the number of men in prison increased just 10 percent.25
- While 9 percent of the people in prison at the end of FY2019 were women, they accounted for 27 percent of the increase in the total prison population between FY2010 and FY2019.26
- Nearly two-thirds of women admitted to prison in FY2019 were admitted for probation sanctions or violations, compared to fewer than half of men.27
KDOC and community-based providers lack the capacity to meet the assessed behavioral health, education, employment, and housing needs of people in the criminal justice system.28
- The majority of people released from prison each year need some type of programming or services: 75 percent need programming to address criminal thinking and social skills, 75 percent need substance use and recovery programming, 75 percent need education or employment services, and 20 percent need housing support.29 Due to limited KDOC capacity, however, access to these services varies widely, and many people return to the community without receiving the assistance they need while incarcerated.30
- Between 2010 and 2018, arrests for drug offenses in Kansas rose 19 percent and admissions to prison for drug offenses rose 62 percent.31
- Between FY2016 and FY2019, the number of people in prison with a serious mental health need increased nearly three times faster than the total prison population in Kansas.32 One-third (33 percent) of the people in prison in FY2019 had an identified mental health need, including 10 percent who were identified as having a severe and persistent mental illness.33
- KDOC offers the Kansas Supportive Housing for Offenders Program (KSHOP), which finds and secures housing and other wraparound services for people reentering the community. The program includes about 40 housing units across the state, but the demand is far greater than the supply, as dictated by current funding parameters. The three KSHOP coordinators across the state are not able to support everyone with housing insecurity who reenters the community.
People in the justice system have struggled to secure employment due to lack of training and other barriers.
- Nearly 3,500 people (about 35 percent) in prison in Kansas do not have a high school diploma or GED, but KDOC is only able to provide education services to about 700 of these people.34
- An estimated 46 percent of people on parole in 2019 were unemployed35 in contrast to a statewide unemployment rate of 3.2 percent at the time.36 As of August 2020, the statewide unemployment rate in Kansas had grown to 6.9 percent.37
- Despite occupational licensing reform in 2018,38 Kansas still has 426 legal and regulatory restrictions that limit or prohibit people convicted of crimes from accessing employment, business, and occupational licensing oppor-tunities in fields such as nursing, cosmetology, and landscape architecture.39 Of these barriers, 204 function as automatic bars that exclude people with disqualifying convictions regardless of mitigating factors like evidence of rehabilitation or whether the offense is related to a particular type of work.40
- Among people who were assessed as more likely to recidivate upon release from prison in Kansas, those who secured employment at a living wage had a 13-percent recidivism rate, those who completed vocational training and secured employment had a 15-percent recidivism rate, and those who received a GED and secured employment had an 18-percent recidivism rate. People in the same group without employment or a certification had a 33-percent recidivism rate.41
The Justice Reinvestment Approach
Step 1: Analyze data and develop policy recommendations
Under the direction of the Commission, CSG Justice Center staff have conducted a comprehensive analysis of sentencing, probation, parole, and incarceration data, using hundreds of thousands of individual data records, as well as summary-level data on crime, arrests, employment-related collateral consequences of conviction, behavioral health, workforce development, and housing. CSG Justice Center staff have also examined probation, parole, and incarcerated population trends; reentry; length of time served in incarceration and on supervision; statutory and administrative policies; availability of treatment and programs designed to reduce recidivism; and existing pathways to employment for people in the justice system, among other factors. The analyses will result in findings related to the sources of correctional population growth, correctional bed capacity, and effectiveness of agency policies and procedures in reducing recidivism.
To incorporate perspectives and recommendations from across the state, CSG Justice Center staff have collected input from people working in and directly impacted by the criminal justice system, including the Kansas attorney general, judges, district attorneys, public defenders, sheriffs, police chiefs, probation and parole officers, behavioral health treatment and housing providers, workforce development and readiness professionals, victims and their advocates, people in the criminal justice system and their advocates, local officials, and others.
With the assistance of CSG Justice Center staff, the Commission will review the analyses and develop data-driven policy recommendations focused on increasing public safety and state investments in corrections. Policy recommendations will be available for the Commission’s consideration in December 2020, and will be provided to state leaders for consideration in early 2021. The possibility of additional assistance from CSG Justice Center staff in 2021 will be explored if the Commission receives an extension to continue working.
Step 2: Adopt new policies and put reinvestment strategies into place
If the policy recommendations are enacted, CSG Justice Center staff will work with Kansas policymakers for a period of up to 12 months to translate the new policies into practice. This assistance will help ensure that related programs and system investments achieve projected out-comes and are implemented using the latest research-based, data-driven strategies. CSG Justice Center staff will develop implementation plans with state and local officials, provide policymakers with frequent progress reports, and deliver testimony to relevant legislative committees.
Step 3: Measure performance
Finally, the CSG Justice Center will help Kansas officials improve statewide data collection and sharing to measure and monitor performance as well as, ultimately, increase the state’s capacity for making data-driven decisions in criminal justice policymaking and budgeting. This could include identifying key data points to record and officials best positioned to collect data, as well as exploring best practices to track, monitor, share, and analyze data. Improving data collection and sharing will allow state leaders to assess the impact of enacted policies on pretrial, probation, post-release supervision, and incarcerated populations, including recidivism rates, and to develop strategies to monitor these outcomes.
Endnotes
- Kansas Sentencing Commission, Fiscal Year 2020 Adult Inmate Prison Population Projections (Topeka, KS: Kansas Sentencing Commission, 2019); Kansas Department of Corrections, Fiscal Year 2019 Annual Report (Topeka, KS: Kansas Department of Corrections, 2020). Cost estimates are based on actual and projected prison populations, the KDOC capacity as of June 2019, and FY2019 operating cost expenditures per incarcerated person for KDOC facilities.
- Kansas Sentencing Commission, Fiscal Year 2020 Adult Inmate Prison Population Projections. The reported KDOC capacity for FY2019 was 9,916, and the year-end prison population was 10,044. Years listed in this report are calendar years unless otherwise noted.
- Kansas Sentencing Commission, Fiscal Year 2020 Adult Inmate Prison Population Projections.
- Ibid.
- Kansas Sentencing Commission, FY 2019 Annual Report (Topeka, KS: Kansas Sentencing Commission, 2020). A total of 944 people were eligible for either a probation or prison sentence based on their criminal history and offense severity (i.e., “border box” sentences). Of these, 168 received a prison sentence and 776 received a probation sentence.
- Kansas Sentencing Commission, FY 2010–2019 Annual Report (Topeka, KS: Kansas Sentencing Commission, 2011–2020).
- Kansas Sentencing Commission, Fiscal Year 2020 Adult Inmate Prison Population Projections; Kansas Sentencing Commission, Fiscal Year 2021 Adult Inmate Prison Population Projections (Topeka, KS: Kansas Sentencing Commission, 2020).
- Violent crimes refers to the FBI’s Uniform Crime Reporting violent crime offenses: murder, rape, robbery, and aggravated assault. Kansas Bureau of Investigation Incident Based Reporting Unit, Kansas Crime Index 2010–2019 (Topeka, KS: Kansas Bureau of Investigation, 2011–2020).
- Federal Bureau of Investigation, Crime in the United States, 2010–2019
(Washington, DC: United States Department of Justice, 2011–2020). - Kansas Bureau of Investigation Incident Based Reporting Unit, Kansas Crime Index 2010–2019. “Population centers” referenced here are Johnson, Sedgwick, Shawnee, Wyandotte, and Douglas Counties. The 10 counties were Rawlins, Phillips, Norton, Greenwood, Sherman, Clay, Cloud, Chatauqua, Ness, and Washington.
- Kansas Bureau of Investigation Incident Based Reporting Unit, Kansas Crime Index 2010–2019.
- Kansas Bureau of Investigation, Domestic Violence, Stalking, and Sexual Assault in Kansas 2018 (Topeka, KS: Kansas Bureau of Investigation, 2019). Domestic violence figures for 2019 were not available as of September 29, 2020.
- Arrest figures for 2019 were not available as of September 29, 2020. Kansas Bureau of Investigation Incident Based Reporting Unit, Kansas Adult Arrests 2008–2018 (Topeka, KS: Kansas Bureau of Investigation, 2009–2019).
- Supreme Court of Kansas, Annual Report of the Courts of Kansas Fiscal Year 2010–2019 (Topeka, KS: Supreme Court of Kansas, 2011–2020).
- CSG Justice Center analysis of KDOC community corrections data, August 2020. Starts are counted per person and probation start date; i.e., if a person started more than one probation term on the same date, they are only counted once. Offense level and type are based on the most serious offense per person and probation start date.
- Ibid. CSG Justice Center analysis of Kansas Sentencing Commission felony sentencing data, September 2020. Ibid. Ibid
- Kansas operates a complicated three-pronged community supervision system: (1) Community Corrections (KDOC provides funding and oversight) is county- or judicial district-linked and supervises all moderate- to high-risk individuals on probation; (2) Court Services (judiciary) is judicial district-based and supervises low-risk individuals and people convicted of misdemeanors on probation; (3) Parole (KDOC) has regional offices that serve all individuals on parole supervision. Each supervision agency operates with distinct and separate assessment, supervision, and programming structures; communication and collaboration between each agency is challenging; and oversight, accountability, and quality assessments of the entire system are difficult to accomplish.
- Kansas Department of Corrections, End-of-Month Offender Population Report: June 2019 (Topeka, KS: Kansas Department of Corrections, 2019). Includes probation sanctions.
- Kansas Legislative Research Department, Report of the Kansas Criminal Justice Reform Commission to the 2020 Kansas Legislature (Topeka, KS: Kansas Criminal Justice Reform Commission, 2019).
- Kansas Department of Corrections, Fiscal Year 2019 Annual Report (Topeka, KS: Kansas Department of Corrections, 2020).
- Email correspondence between CSG Justice Center and Kansas Department of Corrections, February 24, 2020. Violation types are not mutually exclusive; people who were revoked may have had more than one of each type of condition violation.
- Kansas Department of Corrections, End-of-Month Offender Population Report: June 2010–2019 (Topeka, KS: Kansas Department of Corrections, 2010–2019).
- Ibid. The total prison population increased by 1,173 people; 319 of these were women.
- Kansas Sentencing Commission, Fiscal Year 2020 Adult Inmate Prison Population Projections. Of women admitted to prison in FY2019, 64 percent were admitted for probation sanctions or violations; of men, 44 percent.
- Jeff Zmuda, “Kansas Department of Corrections Presentation to the Criminal Justice Reform Commission” (PowerPoint presentation, Kansas Criminal Justice Reform Commission, Topeka, KS, October, 28, 2019).
- Ibid.
- Ibid.
- Kansas Bureau of Investigation Incident Based Reporting Unit, Kansas Adult Arrests 2010–2018 (Topeka, KS: Kansas Bureau of Investigation, 2011–2019); Kansas Sentencing Commission, FY 2010–2018 Annual Report (Topeka, KS: Kansas Sentencing Commission, 2011–2019). Arrest numbers are reported by calendar year (January 1 to December 31), and numbers for 2019 were not available as of the publication of this report. Admissions to prison are reported by fiscal year (July 1 to June 30) and are based on all admission types, including supervision violations.
- Kansas Department of Corrections, Fiscal Year 2016–2019 Annual Report (Topeka, KS: Kansas Department of Corrections, 2017–2020); email correspondence between CSG Justice Center and Kansas Department of Corrections, October 16, 2019. Based on the total average daily population for FY2016 and FY2019 and the number of people in prison who were identified as “Severely Persistently Mentally Ill” (SPMI) or as having Serious Mental Illness (SMI) in FY2016 and FY2019. The total average daily population increased 4 percent between FY2016 and FY2019, while the average daily population with SPMI or SMI increased 11 percent. These figures were not available for fiscal years prior to 2016.
- Kansas Department of Corrections, Fiscal Year 2019 Annual Report. Percentages are based on the average daily population for FY2019 and the number of people in prison who were identified as having SPMI or SMI.
- Zmuda, “Kansas Department of Corrections Presentation to the Criminal Justice Reform Commission.”
- Email correspondence between CSG Justice Center and Kansas Department of Corrections, February 24, 2020. Of the 5,080 people on parole at that time, 2,416 were employed; 485 of the 5,080 were identified as not employable, so the percentage is calculated as 2,416 ÷ 4,595.
- “States and Selected Areas: Employment Status of the Civilian Noninstitutional Population, January 1976 to Date, Seasonally Adjusted,” Bureau of Labor Statistics, accessed February 12, 2020, https://www.bls.gov/web/laus/ststdsadata.txt. Unemployment rate is based on total civilian workforce numbers for December 2019.
- “Kansas Economy at a Glance” U.S. Bureau of Labor Statistics, accessed September 25, 2020, https://www.bls.gov/eag/eag.ks.htm.
- Kan. Stat. Ann. § 74-120, 2018.
- “Collateral Consequences Inventory,” National Inventory of Collateral Consequences of Conviction, accessed June 23, 2020, https://niccc. csgjusticecenter.org/database/results/?jurisdiction=253&consequence_ category=236%2C234%2C377%2C396&narrow_category=&triggering_offense_ category=&consequence_type=&duration_category=&page_number=1.
- Ibid. Eric Lichtenberger, The Relationship Between Select Correctional Education Programming, Consistent and Quality Employment, and Recidivism (Topeka, KS: Kansas Department of Corrections, 2014).
- Kan. Stat. Ann. § 74-120, 2018.
- “Collateral Consequences Inventory,” National Inventory of Collateral Consequences of Conviction, accessed June 23, 2020, https://niccc.csgjusticecenter.org/database/results/?jurisdiction=253&consequence_category=236%2C234%2C377%2C396&narrow_category=&triggering_offense_category=&consequence_type=&duration_category=&page_number=1.
- Ibid.
- Eric Lichtenberger, The Relationship Between Select Correctional Education Programming, Consistent and Quality Employment, and Recidivism (Topeka, KS: Kansas Department of Corrections, 2014).
This project was supported by Grant No. 2019- ZB-BX-K002 awarded by the Bureau of Justice Assistance. The Bureau of Justice Assistance is a component of the Department of Justice’s Office of Justice Programs, which also includes the Bureau of Justice Statistics, the National Institute of Justice, the Office of Juvenile Justice and Delinquency Prevention, the Office for Victims of Crime, and the SMART Office. Points of view or opinions in this document are those of the author and do not necessarily represent the official position or policies of the U.S. Department of Justice.
The Council of State Governments (CSG) Justice Center is a national nonprofit, nonpartisan organization that combines the power of a membership association, representing state officials in all three branches of government, with policy and research expertise to develop strategies that increase public safety and strengthen communities. For more information about the CSG Justice Center, visit www.csgjusticecenter.org.

Research and analysis described in this report has been funded in part by The Pew Charitable Trusts public safety performance project. Launched in 2006 as a project of the Pew Center on the States, the public safety performance project seeks to help states advance fiscally sound, data-driven policies and practices in sentencing and corrections that protect public safety, hold people accountable, and control corrections costs. To learn more about the project, please visit pewtrusts.org/publicsafety.