Report
Table of Contents
Introduction
Between April 2021 and February 2022, with funding and support from the U.S. Department of Justice’s Office of Justice Programs, Bureau of Justice Assistance (BJA), The Council of State Governments (CSG) Justice Center conducted an analysis of racial equity across Montana’s criminal justice system, in partnership with Montana judicial branch stakeholders.
This project builds on previous work by CSG Justice Center staff in Montana as part of the Justice Reinvestment Initiative (JRI), which documented initial evidence of racial disparities between White and American Indian people in arrests and corrections populations.12 However, because JRI was not focused exclusively on racial equity issues, more in-depth analysis was not possible at that time.
In light of these previous findings, this new analysis aimed to investigate patterns of racial disparity across the criminal justice system, to the extent that they exist, and provide insight into the drivers behind them in order to offer actionable recommendations to address them. Additionally, this work sought to closely document any data gaps or data quality issues so that the judicial branch can improve any racial equity-related data collection challenges within the court system. Specifically, CSG Justice Center staff’s racial equity analysis includes the following key components: (a) an in-depth analysis of sentencing and supervision revocation decisions across racial groups and (b) a high-level analysis of existing data in the court systems to identify strategies to improve future data collection and monitoring related to racial disparity. This report focuses on results from component (a); an accompanying report, Availability of Defendants’ Race and Ethnicity Information in Montana’s Case Management System, details component (b), including the results of an assessment of court data quality.
This project focuses on American Indian-White racial disparities in Montana’s criminal justice system due to several data and methodological limitations (detailed in the Analytic Approach section).
However, national research shows that criminal justice disparities impact other racial and ethnic groups as well.13 CSG Justice Center staff’s recommendations offer strategies that Montana’s court system can adopt to make it possible to conduct a more comprehensive assessment of disparities in the future.
This report describes the results of analysis of criminal justice system data for the five-year period between January 2016 and December 2020 and is organized into the following sections:
- A background section that reviews findings from CSG Justice Center staff’s earlier analysis of racial disparity in Montana’s criminal justice system and provides context from the broader research literature on racial disparity in the criminal justice system in the U.S.
- An analytic approach section, which provides an overview of the data sources and quantitative methods used in this analysis
- A summary of results addressing the extent to which American Indian-White racial disparities exist in sentencing and supervision revocation decisions
- Data-driven policy recommendations that outline a path forward to advance racial equity in the state
Background
Throughout the United States, Black, Indigenous, and People of Color (BIPOC) groups face incarceration rates that are often much higher than White populations14 despite progress in reducing such disparities for Black and Hispanic groups in recent decades.15
A large body of research documents the role of historical and ongoing forms of systemic racism in creating and perpetuating these racial disparities.16 Although research on racial disparities in criminal justice has focused on Black and Hispanic people, a limited body of work indicates that American Indian people face disparities similar to those of other BIPOC groups. For example, some studies have shown that American Indian people receive harsher sentences than similarly situated White people.17 Several studies suggest that American Indian people face disparities in supervision revocations as well.18
In Montana, American Indian people comprised 6.2 percent of the total population in 2020, the fifth largest proportion of any state.19 Previous analysis conducted by CSG Justice Center staff has shown that American Indian people are disproportionately represented in Montana’s criminal justice system. Specifically, as part of JRI work conducted in 2015 and 2016, CSG Justice Center staff’s assessment of Fiscal Year (FY) 2015 arrest and corrections populations data highlighted the following key findings:20
- Despite comprising approximately 7 percent of the state’s total population in 2015, American Indian people accounted for 19 percent of total arrests. This disparity in arrests was driven by failures to appear (FTA) and supervision violations.
- American Indian people were also disproportionately represented in the corrections system, where they accounted for 17 percent of the total correctional facility population.
Racial disparity refers to any situation in which different racial groups experience unequal treatment or outcomes.21
Evidence of disparity is distinct from understanding the processes that contribute to it.
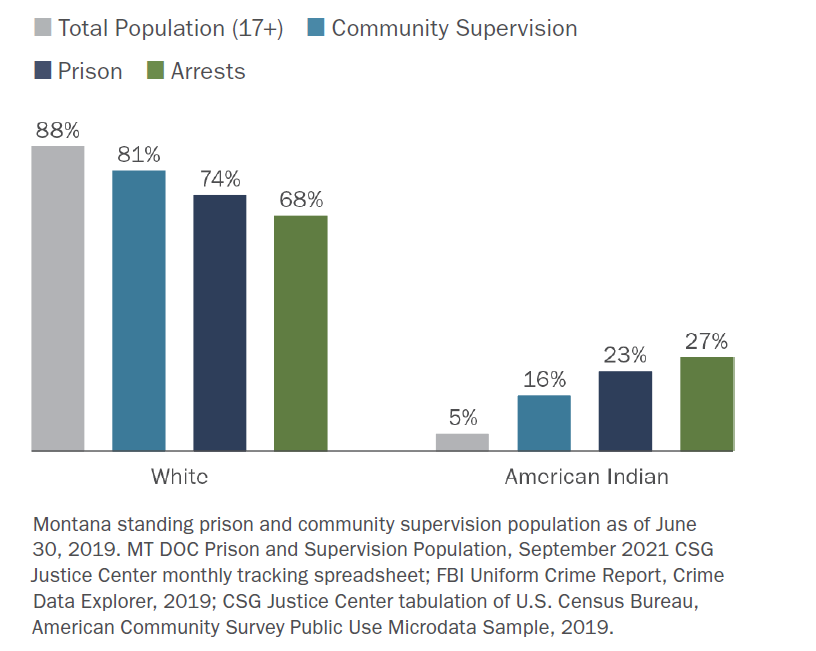
CSG Justice Center staff’s new racial analysis reexamined key criminal justice statistics and identified similar disparities. As depicted in Figure 1 below, in 2019, American Indian people were overrepresented in community supervision and prison populations, and in arrests, relative to their representation in the general state population.
Figure 1: White and American Indian People as a Percentage of Total Adult and Justice-Involved Populations
With this background in mind, CSG Justice Center staff’s current analysis delves further into criminal justice data to provide insight into key decision-making points and factors that are potentially associated with racial disparities.
Analytic Approach
The research literature on racial inequity uses a variety of terms to describe how to measure differences between racial groups.22 For the purposes of this analysis, CSG Justice Center staff were careful to distinguish between disparities in outcomes versus disparities in treatment. Disparities in outcomes can be observed by examining differences in group-level rates; for example, one might compare the incarceration rate of one group to another. While such disparities are important to document, they do not provide much insight into factors that may or may not be contributing to the observed disparity.
Another approach is to analyze disparities in treatment— for instance, comparing judicial sentencing decisions or supervision revocation decisions. This approach requires comparisons to be made between similarly situated, otherwise indistinguishable people from different racial groups. Analysis of disparities in treatment can provide more actionable information that criminal justice system actors can use to craft better policy and practice by identifying issues at specific decision-making points.
With these distinctions in mind, this analysis focuses strategically on estimating racial disparities in treatment to empower Montana criminal justice system stakeholders with actionable information. Specifically, this project investigates the extent to which racial disparities exist in incarceration sentencing decisions; prison length of stay; and revocations of probation, conditional release, and parole.
Importantly, due to data and sample size limitations, this analysis pertains exclusively to American Indian and White people who have been convicted of a felony offense. There are two major reasons for this. First, there was insufficient race and ethnicity data in the court data system. On average, across all courts, defendants’ race and ethnicity information was missing in 32 percent of cases filed between 2015 and 2020. For details, see the accompanying report Availability of Defendants’ Race and Ethnicity Information in Montana’s Case Management System. Due to these data limitations, CSG Justice Center staff were unable to examine the pool of people who were charged with a felony but not convicted or people who were charged with misdemeanors. Instead, the analysis of sentencing decisions was conducted using Montana Department of Corrections (MT DOC) data, which track people from the point of a felony conviction.
Due to data and sample size limitations, analysis of racial equity in sentencing and supervision revocations focuses exclusively on disparities between American Indian and White people who have been convicted of a felony.
Second, the statistical methods used in this analysis require a minimum sample size, and among the population of people convicted of a felony offense, only American Indian and White people met these requirements. Other important racial and ethnic disparities (e.g., impacting Black or Hispanic populations) may very well exist across Montana’s criminal justice system, and as more data become available within the Montana courts, future analysis should investigate those as well.
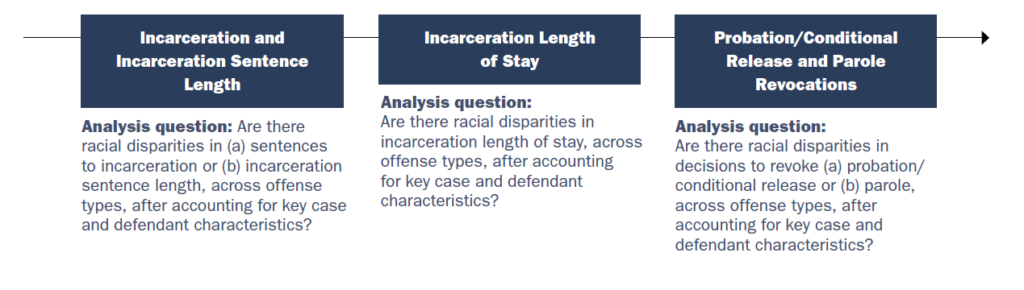
CSG Justice Center staff used quantitative research methods to conduct an analysis of racial equity and develop data-driven policy recommendations to address observed racial disparities in Montana. Data for the in-depth analysis detailed in this report were obtained from the MT DOC, which manages data on people in state prison, alternative secure facilities (such as treatment centers), and on community supervision. Additional data on Montana’s general population were obtained from the U.S. Census Bureau. Datasets were cleaned and analyzed using standard statistical methods, including relative rate index calculations and regression analysis. Through these activities, this work aimed to address the following key analysis questions:
- Are there racial disparities in (a) sentences to incarceration or (b) incarceration sentence length, across offense types, after accounting for key case and defendant characteristics?
- Are there racial disparities in incarceration length of stay, across offense types, after accounting for key case and defendant characteristics?
- Are there racial disparities in decisions to revoke (a) probation/conditional release or (b) parole, across offense types, after accounting for key case and defendant characteristics?
Figure 2. Analysis Questions
Quantitative Data Sources and Measures
MT DOC: The main dataset analyzed for this project was obtained via a data use agreement between the CSG Justice Center and MT DOC. MT DOC staff shared data from January 1, 2016, through December 31, 2020, on three groups of people: (1) people with an original sentence for a felony conviction with a pronouncement (i.e., sentencing) date during the study period (probation violations were excluded); (2) people in custody of MT DOC, including people incarcerated in state prison as well as people in alternative secure facilities, such as treatment centers and prerelease centers; and (3) people on community supervision, including probation, conditional release, and parole. After data were cleaned and eligible cases were identified, CSG Justice Center staff constructed a series of analytic samples (for details, including a summary of the entire analytic approach, see Table 1).
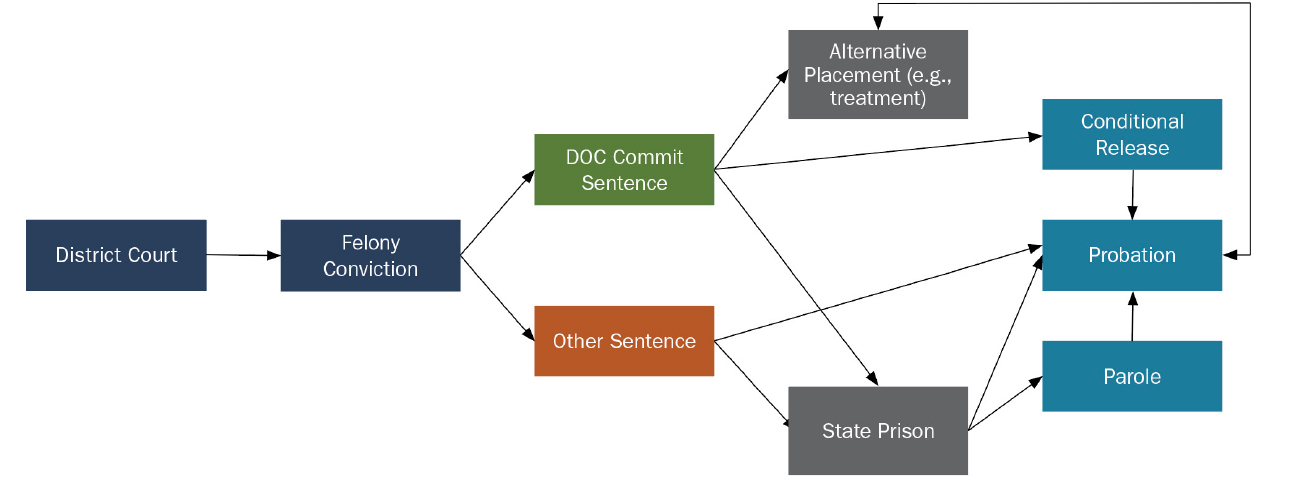
Importantly, for felony convictions, Montana’s sentencing judges have a special sentencing option called “DOC commit.” A sentence to DOC commit means that MT DOC staff will complete an assessment of the sentenced person’s risks and needs and then make a placement decision. This placement decision by MT DOC can result in incarceration or community supervision. In cases where MT DOC places a person on community supervision, the supervision is termed conditional release. In practice, conditional release is like probation—the staff, risk and needs assessment tools, and policies regarding sanctions and incentives are the same.23 However, conditional release is distinct from probation in one important way: decisions to revoke are made by MT DOC for people in the conditional release group, whereas a judge must make a revocation decision for people on probation.24
Figure 3. Pathways after Felony Conviction
U.S. Census data: CSG Justice Center staff also obtained publicly available Census data.25 Specifically, information on the number of American Indian and White Montana residents, ages 17 years and older, was obtained to calculate each group’s respective rates of incarceration, community supervision, and arrest (as reported in Figure 1 above).
Key measures and quantitative methods: To address analysis questions for this project, regression was employed to examine relevant outcomes—including incarceration sentencing and placement decisions (Analysis Questions 1a–b); length of stay (Analysis Question 2); and probation, conditional release, and parole revocations (Analysis Questions 3a–b). Regression analysis is a common approach for comparing differences in outcomes between two groups, particularly when there is an interest in making an “apples to apples” comparison between those groups.
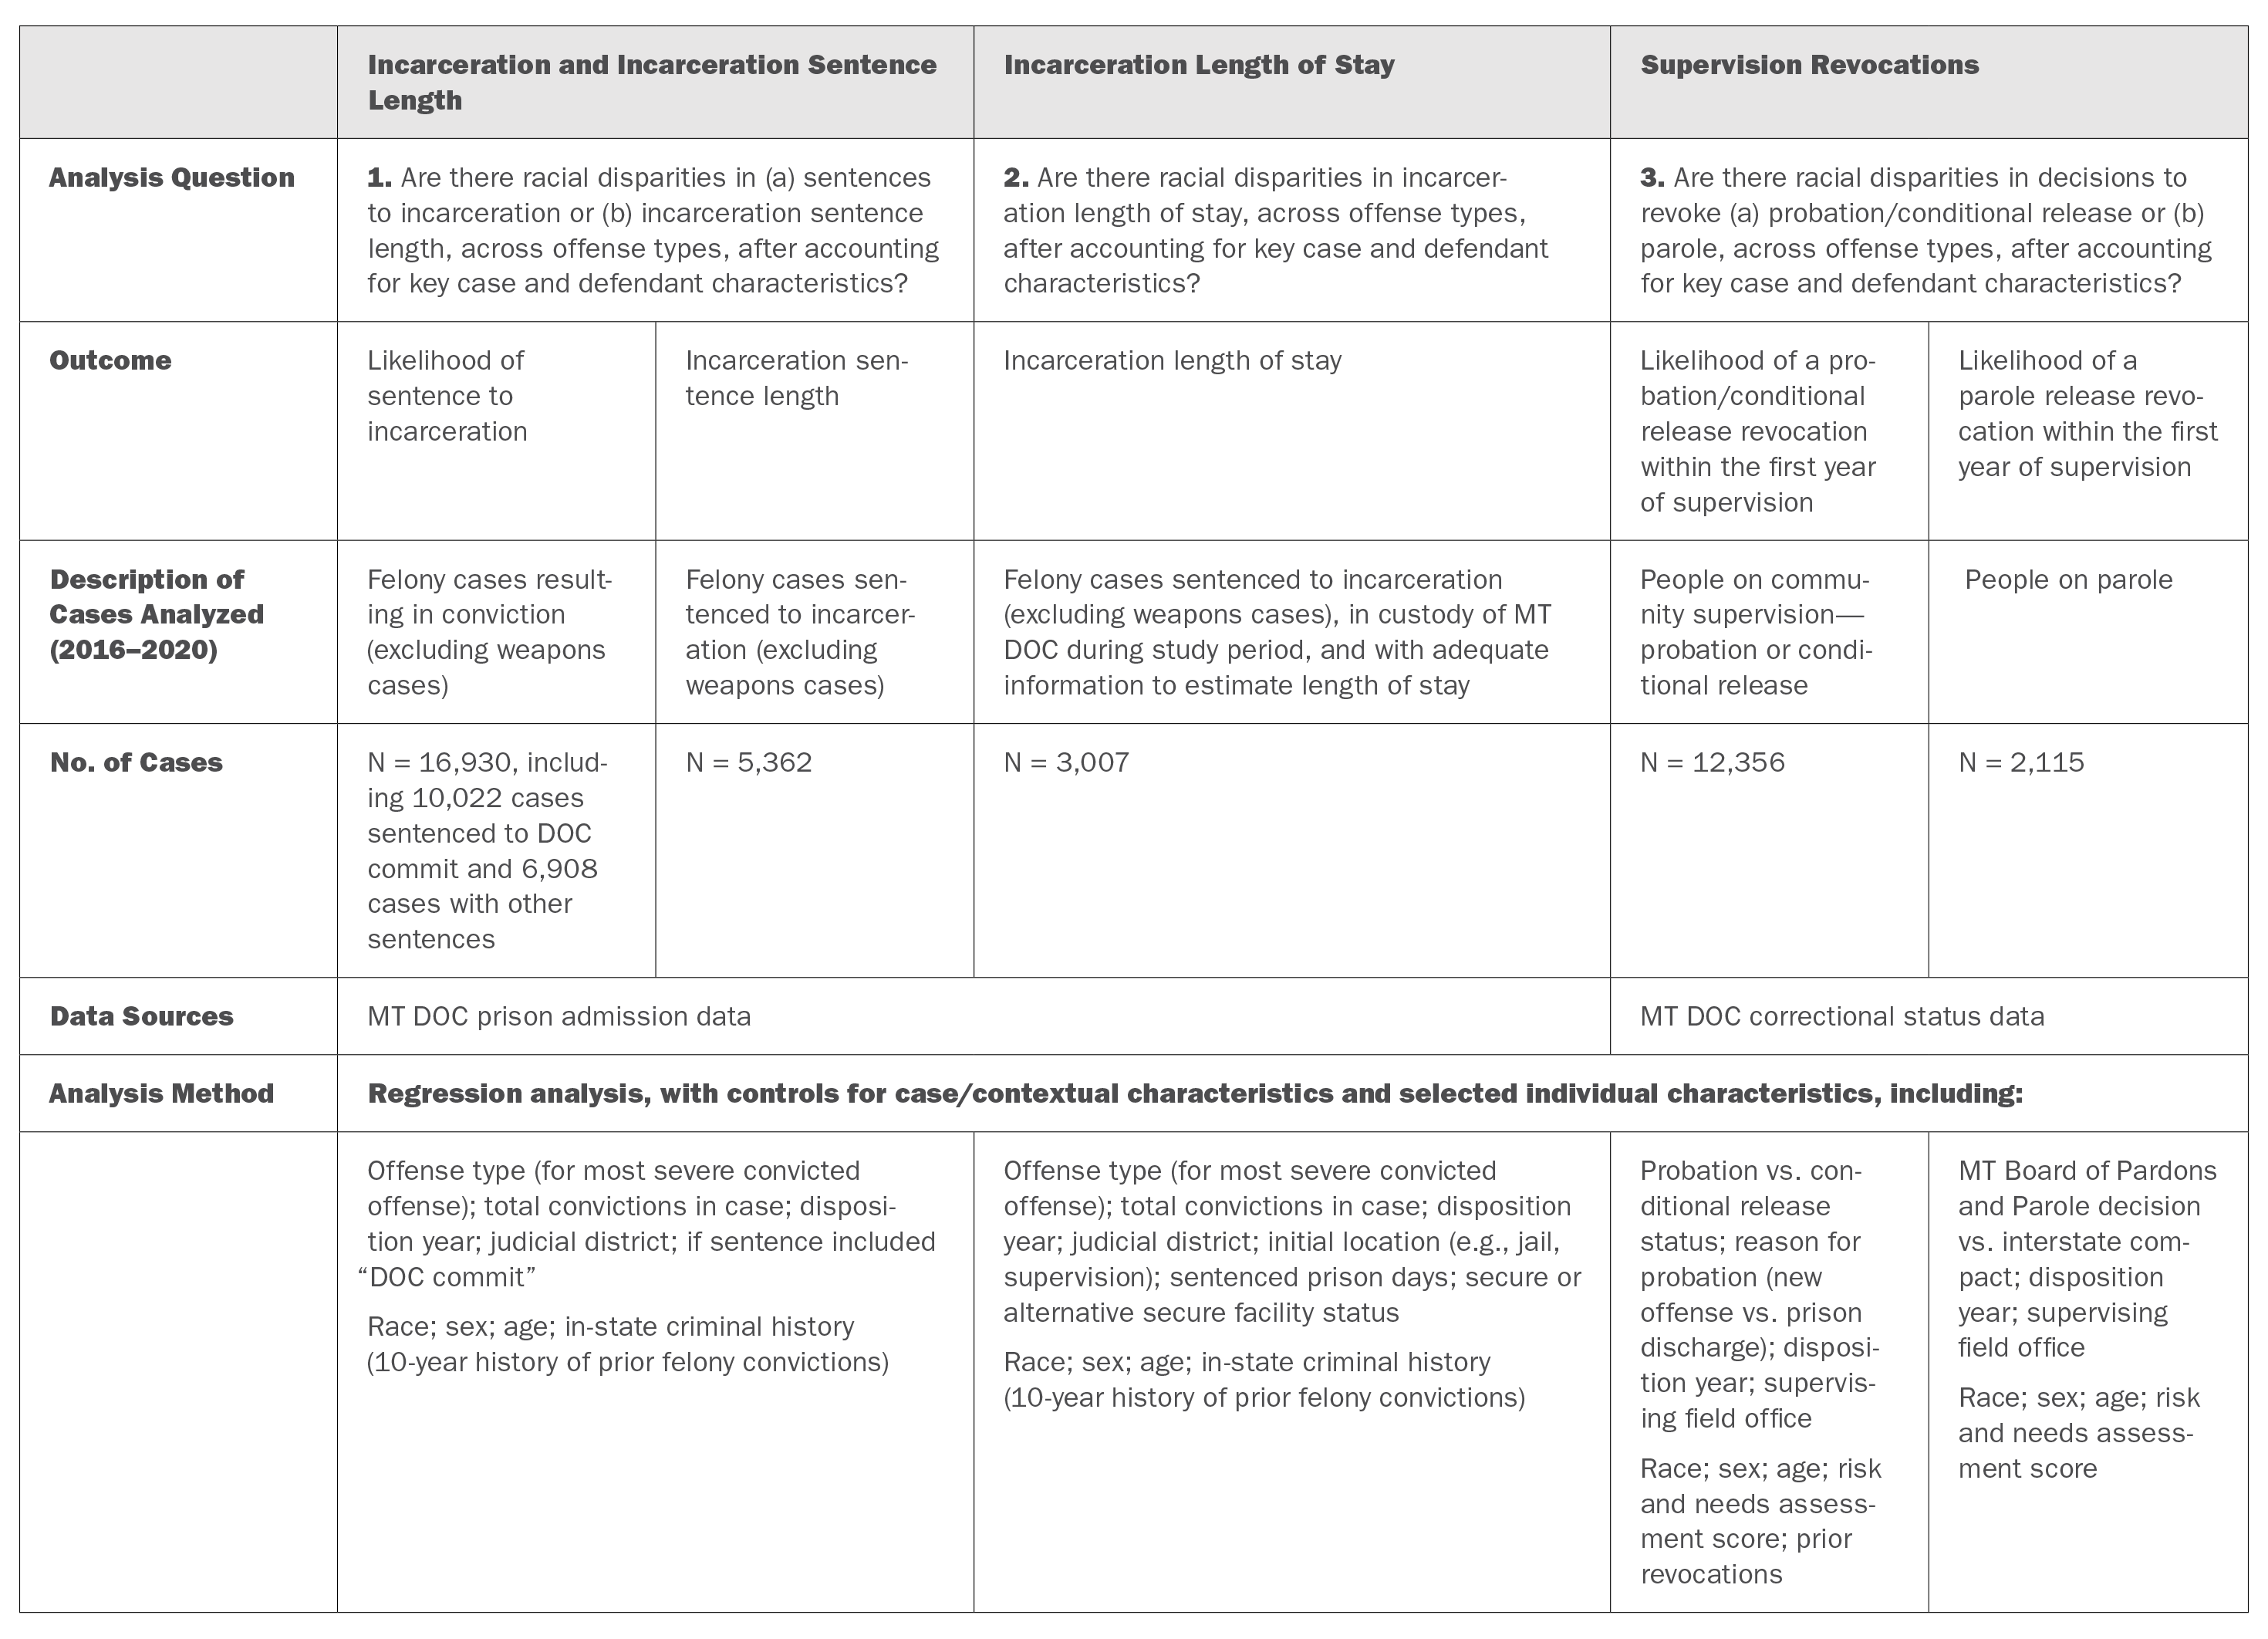
Regression analysis for each analysis question considered relevant case or contextual characteristics as well as individual characteristics, which CSG Justice Center staff constructed using data obtained from MT DOC. Information on specific variables used for each set of analyses are summarized in Table 1 below and within each respective subsection of the Results. As with any analysis project, there were some factors that could not be accounted for due to limited data availability. For example, MT DOC’s data system does not have measures of the use of sanctions and rewards in community supervision that are ready for quantitative analysis.
Results of regression analysis are reported below as “relative rate indices” and “predicted” outcomes.
Importantly, where applicable, CSG Justice Center staff used regression output to obtain adjusted relative rate indices. This process was used for all analyses involving a binary (dichotomous) outcome variable; binary outcomes included incarceration sentencing and placement decisions (Analysis Questions 1a–b) and probation, conditional release, and parole revocations (Analysis Questions 3a–b), but not length of stay (Analysis Question 2).
Table 1 below summarizes key details of the analytic approach, including information on research questions, outcomes examined, case counts, data sources, and analysis conducted.
Table 1. Summary of Analytic Approach and Results
Notes
12. William J. Sabol, Thaddeus L. Johnson, and Alexander Caccavale, Trends in Correctional Control by Race and Sex (Washington, DC: Council on Criminal Justice, 2019).
13. Ibid.
14. E. Ann Carson, Prisoners in 2019 (Washington, DC: Bureau of Justice Statistics, 2020); “Since you asked: What data exists about Native American people in the criminal justice system?” The Prison Policy Initiative, 2020, accessed August 20, 2021, https://www.prisonpolicy.org/blog/2020/04/22/native/. Analysis conducted in 2010 by the Prison Policy Initiative showed that American Indian people are incarcerated at over twice the rate of White people on average in the U.S., but that in some states, American Indian people are incarcerated at seven times the rate of White people.
15. Sabol, Johnson, and Caccavale, Trends in Correctional Control by Race and Sex.
16. Jeremy Travis, Bruce Western, and F. Stevens Redburn, The Growth of Incarceration in the United States: Exploring Causes and Consequences (Washington, DC: National Research Council, 2014). For an overview of this topic, see Susan Nembhard and Lily Robin, Racial and Ethnic Disparities throughout the Criminal Legal System: A Result of Racist Policies and Discretionary Practices (Washington, DC: Urban Institute, 2021). For a discussion of the recent literature on this topic, see “There’s Overwhelming Evidence that the Criminal Justice System is Racist” editorial, Washington Post, June 10, 2020, https://www.washingtonpost.com/graphics/2020/opinions/systemic-racism-police-evidence-criminal-justice-system/.
17. Alexander Alvarez and Ronet D. Bachman, “American Indians and sentencing disparity: An Arizona test,” Journal of Criminal Justice 24, no. 6 (1996): 549–561; Keith A. Wilmot and Miriam A. Delone, “Sentencing of Native Americans: A Multistage Analysis Under the Minnesota Sentencing Guidelines,” Journal of Ethnicity in Criminal Justice 8, no. 3 (2010): 151–180; Travis W. Franklin, “Sentencing Native Americans in US Federal Courts: An Examination of Disparity,” Justice Quarterly 30, no. 2 (2013): 310–339.
18. Kevin F. Steinmetz and Jamilya O. Anderson, “A Probation Profanation: Race, Ethnicity, and Probation in a Midwestern Sample,” Race and Justice 6, no. 4 (2015): 1–25; Kelly Roberts Freeman et al., Reducing Probation Revocations in Pima County, Arizona (Washington, DC: Urban Institute, 2021).
19. “Race and Ethnicity in the United States: 2010 Census and 2020 Census,” U.S Census Bureau, https://www.census.gov/library/visualizations/interactive/race-and-ethnicity-in-the-united-state-2010-and-2020-census.html.
20. The Council of State Governments Justice Center, Justice Reinvestment in Montana: Report to the Montana Commission on Sentencing.
21. Development Services Group, Inc. Disproportionate Minority Contact (Washington, D.C.: Office of Juvenile Justice and Delinquency Prevention, 2014). Accessed May 3, 2021, https://www.ojjdp.gov/mpg/litreviews/Disproportionate_Minority_Contact.pdf
22. “Race and Ethnicity in the United States: 2010 Census and 2020 Census,” U.S Census Bureau, https://www.census.gov/library/visualizations/interactive/race-and-ethnicity-in-the-united-state-2010-and-2020-census.html.
23. Meeting between The Council of State Governments and Montana Departments of Corrections Probation and Parole Division, November 29, 2021.
24. Ibid.
25. American Community Survey Public Use Microdata Sample, 2019, U.S. Census Bureau.