Justice Reinvestment in Vermont
Background
Despite decreases in Vermont’s correctional populations, the state is struggling to reduce rates of recidivism and statewide opioid overdose deaths while also grappling with increases in the women’s prison population and racial disparities within the state’s justice system. At the same time, policymakers’ efforts to address these challenges have been thwarted by overcrowding in state prison facilities, the persistent cost of holding over 200 people in out-of-state prisons and a lack of staff capacity to analyze justice system data to understand what’s contributing to the challenges and how best to address them cost-effectively.
Vermont incarcerates more people than the state’s correctional facilities can accommodate, and, as a result, contracts with out-of- state prison facilities to hold 211 people serving Vermont sentences. With limited staff dedicated to criminal justice analytical research, the state is unable to fully understand the cause of the overcrowding. To date, Vermont has struggled to identify certain criminal justice population trends, such as pretrial detainee and prison admission trends and whether admissions are driven by new crimes or violations by people on supervision. Additionally, without data analysis, policymakers have struggled to answer questions about racial disparities in incarceration and the rising number of women incarcerated. Finally, while overall crime rates are low in Vermont, an increase in some violent crime categories demands that state leaders gain a better understanding of where crime is happening and why.
To address these challenges, in July 2019, Vermont Governor Phil Scott, Chief Justice Paul L. Reiber, Senate President Tim Ashe, Speaker of the House Mitzi Johnson, and Department of Corrections (DOC) Commissioner Mike Touchette requested support from the U.S. Department of Justice’s Bureau of Justice Assistance (BJA) and The Pew Charitable Trusts (Pew) to explore a Justice Reinvestment approach to address these challenges. As public-private partners in the federal Justice Reinvestment Initiative, BJA and Pew approved Vermont state leaders’ request and asked The Council of State Governments (CSG) Justice Center to provide intensive technical assistance. CSG Justice Center staff are collecting and analyzing data and will assist in developing appropriate policy options to help prioritize corrections resources and prison space.
Under the direction of Vermont’s Justice Reinvestment II Working Group, CSG Justice Center staff are conducting a comprehensive analysis of data collected from various relevant state agencies and departments.1 To build a complete picture of statewide criminal justice trends, Vermont’s National Incident-Based Reporting Systems reported crime, DOC, and court data are being collected and analyzed where possible. CSG Justice Center staff are also convening focus groups and leading interviews with key stakeholders in Vermont’s criminal justice, health, and housing systems. Based on the findings from these extensive quantitative and qualitative analyses, the Justice Reinvestment II Working Group will develop policy options that are designed to increase public safety and ensure that corrections beds and resources are prioritized for people incarcerated for serious offenses. Resultant savings can then be reinvested in strategies to reduce recidivism and crime, improve responses to opioid addiction challenges, and increase public safety and public health.
This overview highlights some recent criminal justice trends in Vermont. Information presented here is based on publicly available national and state data sources and does not include Justice Reinvestment II data analysis in Vermont.
Criminal Justice System Trends in Vermont
Community supervision populations have decreased considerably over the last decade, but recidivism rates have risen in recent years.
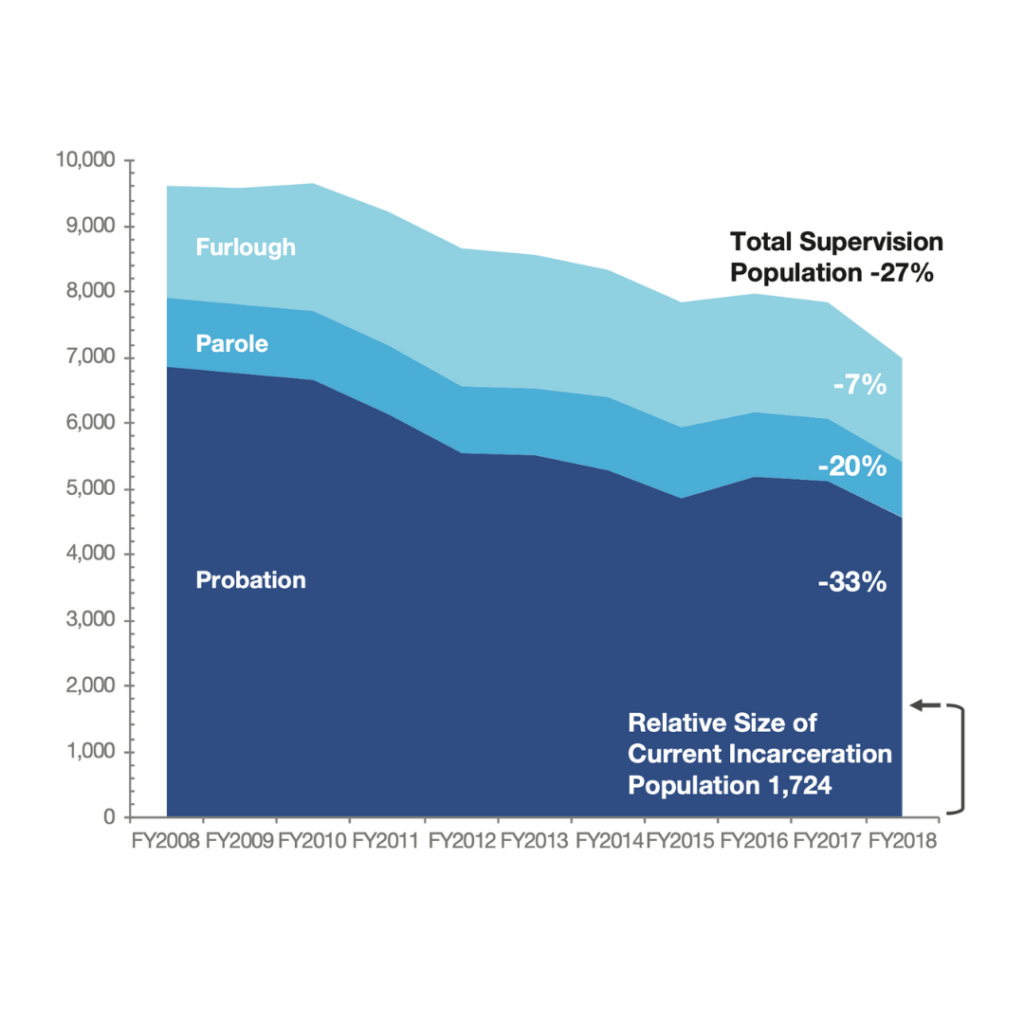
- Vermont’s parole population is down 20 percent, from 1,049 people in 2008 to 840 in 2018. During the same period, the number of people supervised on furlough also declined from 1,714 to 1,591, a 7-percent decrease.2 Among people supervised on probation, the decrease has been even greater, with a 33-percent drop, from 6,863 people on probation in 2008 to 4,570 in 2018.3 (See Figure 1.)
- Although Vermont historically has had a stable three-year return-to-prison rate, it slowly and steadily increased between 2010 and 2015, rising from 43 to 52 percent (for cohorts released between 2010 and 2015). However, there are data quality issues with 2014 and 2015 recidivism rates stemming from DOC’s migration to a new data system in 2014.5
Figure 1. Vermont Supervised Population by Status at Fiscal Year End, FY2008–FY20184
Vermont’s drug overdose death rate has increased significantly in recent years and the state has expanded access to treatment as a result.
- Between 2007 and 2017, Vermont’s drug overdose death rate increased 115 percent, from 10.8 to 23.2 deaths per 100,000 residents.6
- The number of opioid-related overdose deaths in Vermont rose from 56 in 2011 to 110 in 2018, a 96-percent increase.7
- Through the Vermont Hub and Spoke medication-assisted treatment (MAT) system, the number of people across Vermont who accessed MAT for opioid addiction increased 174 percent between 2012 and 2019.8
- DOC is a designated “spoke” in the system, and DOC staff estimate that in 2019, over one-third of the state’s prison population are eligible to receive MAT for opioid addiction in prison.9
- Between July 2018 and July 2019, the number of people in DOC facilities receiving MAT treatment increased 370 percent, from 176 to 827 people.10
- Data analysis is underway within the justice and health systems to understand how this expansion of MAT is impacting public health and recidivism outcomes for these people.
Vermont’s prison population has decreased over the last decade, but the state’s prisons are still over capacity, the women’s prison population is growing, and the incarceration rate for black people is disproportionately high.
- Between 2008 and 2018, Vermont’s incarceration population decreased 16 percent, from 2,053 to 1,724 people. (See Figure 2.)11 The state incarceration population consists of people who are detained pretrial and/or serving sentences in Vermont DOC facilities and people who are serving sentences in out-of- state contract facilities.
- The in-state sentenced population declined 12 percent between 2008 and 2018, and the out-of-state sentenced population dropped 57 percent during the same period. However, the state’s pretrial population increased 30 percent during this time, straining the number of available DOC beds.12
Figure 2. Vermont Fiscal Year-End Incarceration Population, FY2008–FY201813
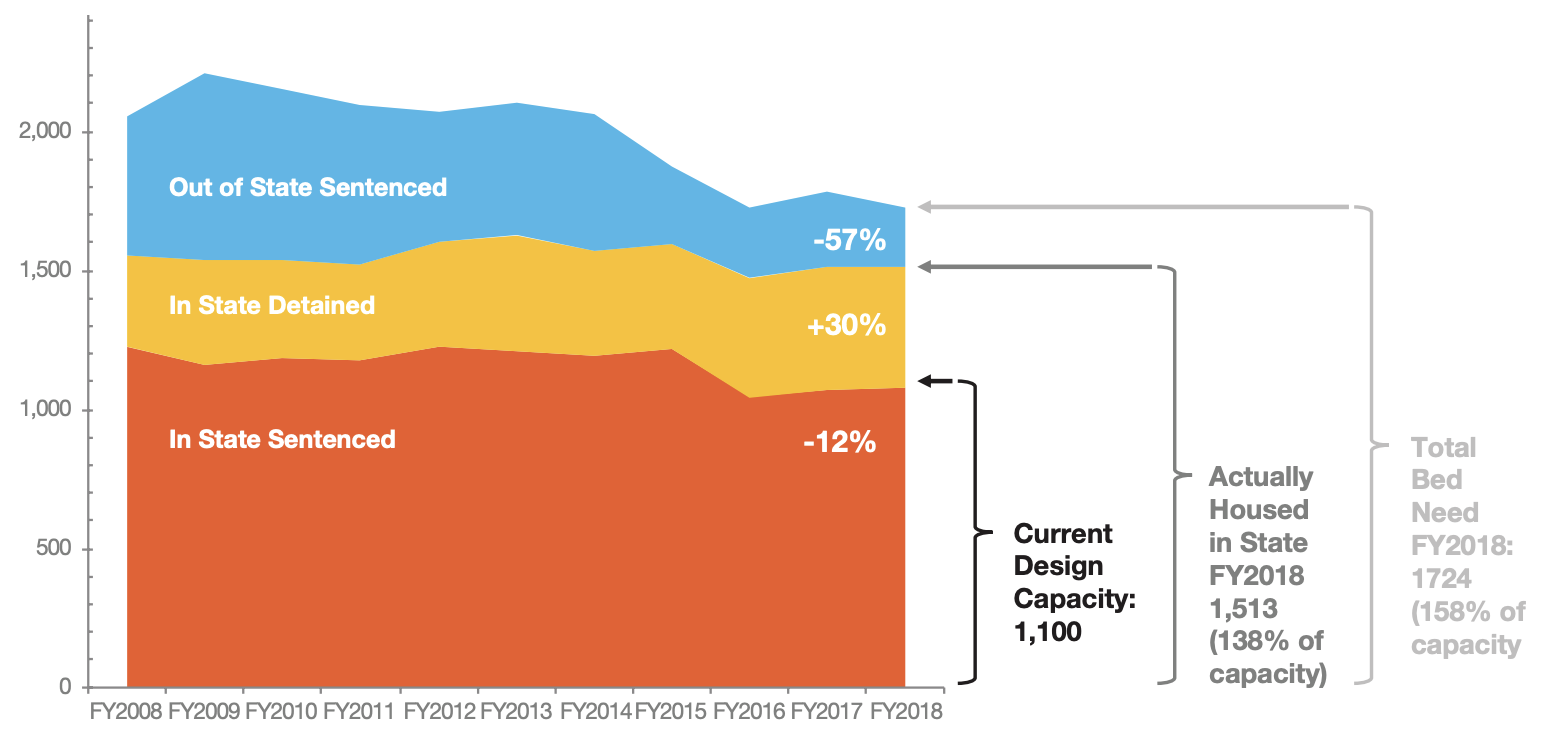
- Vermont is responsible for incarcerating over 1,700 people but operates prison facilities designed to house only 1,100. In 2018, Vermont’s prisons were operating at 138 percent of capacity, with 1,513 people housed across 7 prison facilities. This does not include an additional 211 people who are being held in out-of-state contract facilities due to prison overcrowding.14
- The proportion of women incarcerated in Vermont increased from 6 percent of the DOC incarcerated population in 2008 to 9 percent in 2018. Though modest, the number of women who are incarcerated in Vermont increased from 135 in 2010 to 153 in 2018, while the number of men who are incarcerated decreased, from 2,018 to 1,571, during the same period.15
- In 2017, black people made up 1.2 percent of the state’s total population but accounted for 11.2 percent of the prison population, while white people represented 92.8 percent of the state’s population but made up 87.6 percent of the prison population.16 In the same year, the incarceration rate for black people in Vermont was nearly 10 times that of the incarceration rate for white people.17
Vermont has limited information on community supervision, pretrial detainee, and prison population trends.
- Vermont is currently unable to examine DOC pretrial detainee and prison admission trends, including how many people on community supervision are revoked to DOC facilities, what types of violations they are revoked for, and their length of stay when they return.18
- Additionally, the state does not have the data analytic capacity to produce a prison population projection, which means Vermont is unable to project future prison population trends, including potential growth.
Despite low overall crime rates, all categories of violent crime rates are rising in Vermont.
- Vermont’s property crime rate was the third lowest among states in 2018, and the violent crime rate was second lowest in the nation. Between 2008 and 2018, the property crime rate declined 50 percent. However, from 2008 to 2018, the state’s violent crime rate rose 27 percent, the sixth-largest percent rate increase in the country. These increases were largely driven by rising reports of rape and aggravated assault.19
- Between 2014 and 2018, there was a 17-percent increase in domestic violence felony court filings.20
- Given the state’s small population, Vermont’s spike in violent crime rates in recent years represents a modest increase in violent crime volume (less than 400 additional reported violent crimes).21
The Justice Reinvestment Approach
Step 1: Analyze data and develop policy options
Under the direction of the Justice Reinvestment II Working Group during the legislature’s interim period, CSG Justice Center staff are conducting a comprehensive analysis of crime, arrest, conviction, sentencing, probation, incarceration, behavioral health, parole, and recidivism data, using hundreds of thousands of individual data records. CSG Justice Center staff are examining probation, furlough, parole, and incarcerated population trends; length of time served in incarceration and on supervision; statutory and administrative policies; and availability of treatment and programs designed to reduce recidivism; among other factors. The analyses will result in findings related to the sources of correctional population growth, correctional bed capacity, and effectiveness of agency policies and procedures.
To incorporate perspectives and recommendations from across the state, CSG Justice Center staff are collecting input from criminal justice system stakeholders, including the Vermont Attorney General, judges, state’s attorneys, public defenders, local police chiefs and state police leadership, community supervision agents, behavioral health treatment providers, housing providers and nonprofit and agency leadership, victims and their advocates, people in the criminal justice system and their advocates, local officials, and others.
With the assistance of CSG Justice Center staff, the Justice Reinvestment II Working Group will review the analyses and develop data- driven policy options focused on increasing public safety and better managing corrections spending. Policy options will be available for the Justice Reinvestment II Working Group’s consideration in January 2020, and recommendations will be provided to the legislature for consideration in early 2020.
Step 2: Adopt new policies and put reinvestment strategies into place
If the policy options are enacted, CSG Justice Center staff will work with Vermont policymakers for a period of up to 12 months to translate the new policies into practice. This assistance will help ensure that related programs and system investments achieve projected outcomes and are implemented using the latest research-based, data-driven strategies. CSG Justice Center staff will develop implementation plans with state and local officials, provide policymakers with frequent progress reports, and deliver testimony to relevant legislative committees.
Step 3: Measure performance
Finally, the CSG Justice Center will help Vermont officials improve statewide data collection and sharing to measure and monitor performance as well as, ultimately, increase the state’s capacity for making data-driven decisions in criminal justice policymaking and budgeting. This could include identifying key data points to record and officials best positioned to collect data, as well as exploring best practices to track, monitor, share, and analyze data. Improving data collection and sharing will allow state leaders to assess the impact of enacted policies on pretrial, probation, post-release supervision, and incarcerated populations, including recidivism rates, and to develop strategies to monitor these outcomes. Typically, this includes a spreadsheet of multiple indicators that makes it easy for policymakers to track the changes occurring in various components of the state’s criminal justice system.
Endnotes
- The Vermont Justice Reinvestment II Working Group was created through Governor Phil Scott’s Executive Order 03-19.
- Furlough supervision (28 V.S.A. § 808) is under the authority of DOC and allows the department to extend the limits of the place of confinement for people serving DOC sentences if the person agrees to comply with conditions of supervision and meets furlough criteria. People who are granted furlough receive a chance to serve time in the community to prepare them for a life after their sentence is completed. Email correspondence between CSG Justice Center and DOC regarding supervision population trends, July 2019.
- Email correspondence between CSG Justice Center and DOC regarding supervision population trends, July 2019. At the time of this publication, 2008–2018 was the most recent 10-year span available.
- Email correspondence between CSG Justice Center and DOC regarding supervision population trends, July 2019.
- Email correspondence between CSG Justice Center and DOC regarding recidivism trends, July 2019.
- “Data Brief 329. Drug Overdose Deaths in the United States, 1999–2017,” Centers for Disease Control and Prevention, accessed September 24, 2019, https://www.cdc.gov/nchs/data/databriefs/db329_ tables-508.pdf#page=3. At the time of this publication. At the time of this publication, the most recent 10-year span of data available was 2007–2017.
- “Opioid Scorecard,” Vermont Department of Health, accessed September 24, 2019, http://www.healthvermont.gov/scorecard-opioids. Recognizing that communities across Vermont are facing the challenge of opioid addiction, the state developed a scorecard to show how Vermont is doing at prevention, screening, intervention, and treatment for Vermonters in recovery. 2011 was the first year the state began tracking the number of accidental (non-suicide) drug deaths involving prescription opioids as part of this Opioids Scorecard initiative.
- “Opioid Scorecard,” Vermont Department of Health, accessed September 24, 2019, https://www.healthvermont.gov/scorecard-opioids. 2012 was the first year the Opioid Scorecard initiative began reporting the number of people accessing MAT. Hub and Spoke is Vermont’s system of MAT, supporting people in recovery for opioid addiction. Nine regional hubs offer daily support for patients with complex addictions. At over 75 local spokes, doctors, nurses, and counselors offer ongoing opioid addiction treatment that is fully integrated with general health care and wellness services. This framework efficiently deploys opioid addiction expertise and helps expand access to treatment for Vermonters.
- Email correspondence between CSG Justice Center and DOC, September 2019 regarding MAT trends for DOC population.
- Email correspondence between CSG Justice Center and DOC regarding MAT trends for DOC population, September 2019. The Vermont state legislature passed Act 176 in the summer of 2018, which expanded access to MAT for people who are incarcerated in Vermont DOC facilities.
- Email correspondence between CSG Justice Center and DOC regarding DOC population trends, July 2019.
- Ibid.
- Email correspondence between CSG Justice Center and DOC regarding DOC population trends, July 2019.
- Ibid.
- Ibid. At the time of this publication, 2010 was the earliest year for which DOC incarceration trends by demographics (gender) were available
- Hispanic or Latino Origin by Race, 2017 American Community Survey 1-Year Estimates,” U.S. Census Bureau. Accessed July 20, 2019, “B03002 HISPANIC OR LATINO ORIGIN BY RACE – Vermont – 2017 American Community Survey 1-Year Estimates“. Email correspondence between CSG Justice Center and DOC, July 2019 regarding demographics of the DOC population. At the time of this publication, 2017 was the most recent year for which the Vermont resident population was available
- Ibid.
- Email correspondence between CSG Justice Center and DOC regarding DOC population trends, July 2019.
- A revised definition of rape was implemented by the FBI in 2013, and reported rape in Vermont continued to increase after this 2013 definition change. It is unclear whether the increase here is a reporting artifact, reporting of rape has increased, or incidents are actually on the rise. “2018 Crime in the USA,” Federal Bureau of Investigation, accessed July 9 2019. https://ucr.fbi.gov/crime-in-the-u.s/2017/ crime-in-the-u.s.-2017. At the time of this publication, 2007 and 2018 were the most recent years for which data were available.
- Vermont Judiciary Annual Statistical Reports (Montpelier, Vermont Judiciary, 2014–2018), https://www.vermontjudiciary.org/about-vermont-judiciary/court-statistics-and-reports. At the time of this publication, 2014–2018 were the latest years for which judiciary court filing information was available.
- “2018 Crime in the USA,” Federal Bureau of Investigation, accessed July 9 2019. https://ucr.fbi.gov/crime-in-the-u.s/2017/crime-in-the-u.s.-2017. At the time of this publication, 2007 and 2018 were the most recent years for which data were available.

This project was supported by Grant No. 2019- ZB-BX-K002 awarded by the Bureau of Justice Assistance. The Bureau of Justice Assistance is a component of the Department of Justice’s Office of Justice Programs, which also includes the Bureau of Justice Statistics, the National Institute of Justice, the Office of Juvenile Justice and Delinquency Prevention, the Office for Victims of Crime, and the SMART Office. Points of view or opinions in this document are those of the author and do not necessarily represent the official position or policies of the U.S. Department of Justice.
The Council of State Governments (CSG) Justice Center is a national nonprofit, nonpartisan organization that combines the power of a membership association, representing state officials in all three branches of government, with policy and research expertise to develop strategies that increase public safety and strengthen communities. For more information about the CSG Justice Center, visit www.csgjusticecenter.org.

Research and analysis described in this report has been funded in part by The Pew Charitable Trusts public safety performance project. Launched in 2006 as a project of the Pew Center on the States, the public safety performance project seeks to help states advance fiscally sound, data-driven policies and practices in sentencing and corrections that protect public safety, hold people accountable, and control corrections costs. To learn more about the project, please visit pewtrusts.org/publicsafety.