Justice Reinvestment Initiative in Minnesota
Minnesota has a long history of innovating and developing new models to advance its criminal justice systems and improve outcomes. It was the first state to adopt sentencing guidelines and has worked to safely reduce its prison and incarcerated populations over the past 20 years. Still, Minnesota’s rate of people under correctional control is 11th highest in the nation, driven by its high probation rate, which is 5th highest in the country.1
In 2019, of the nearly 122,000 people under correctional control in Minnesota, 87 percent were on community supervision.2 Additionally, Black and Native American people are overrepresented across Minnesota’s criminal justice system, and the complex system by which probation is administered and funded has led to inconsistent access to critical services for people on probation. It also limits state and local leaders’ ability to analyze community corrections trends and implement best practices to achieve better outcomes for people and communities across the state. Minnesotans deserve a first-rate community supervision system that provides individuals with the supervision and services they require to successfully and safely transition back into their community.
In Minnesota, the annual cost of managing correctional facilities, supporting county supervision partners, and providing reentry services totals well over $600 million.3 As budgets have increased over time, and complex funding structures have evolved,4 Minnesota has not completed an independent, comprehensive assessment of the dollars spent to determine the impact on public safety until now. State and county leaders are committed to using data and engaging extensively with people across the state to conduct such an assessment with the goal of making the community supervision system cost-effective, equitable, and just while balancing state and local responsibility.
In the spring of 2021, Governor Tim Walz, Chief Justice Lorie Skjerven Gildea, Speaker of the House Melissa Hortman, then-Senate Majority Leader Paul Gazelka, Senator Julie A. Rosen, and Association of Minnesota Counties then-President Rich Sve requested support from the U.S. Department of Justice’s Office of Justice Programs, Bureau of Justice Assistance (BJA) and The Pew Charitable Trusts (Pew) to utilize a Justice Reinvestment Initiative (JRI) approach to address these challenges. As public-private partners in the federal JRI program, BJA and Pew approved Minnesota state leaders’ request and asked The Council of State Governments (CSG) Justice Center to partner with state leaders in this effort. Through JRI, Minnesota is using an independent, bipartisan, inter branch approach for the first time to address its fractured probation supervision system with systemic recommendations to improve supervision across the state.
The Governor’s Council on Justice Reinvestment—a bipartisan, inter branch committee created through Executive Order 21-34—and the Delivery System Standards and Funding Policy Working Group—a committee established in House Filing (HF) 63 to update the state’s supervision funding formula—are overseeing the project. Under their direction, CSG Justice Center staff analyzed case-level sentencing, probation, and prison data to learn more about criminal justice trends and outcomes in the state. CSG Justice Center staff also convened focus groups, conducted assessments, and interviewed key stakeholders in Minnesota’s criminal justice system. Based on the findings from these quantitative and qualitative analyses, the Governor’s Council on Justice Reinvestment and the Delivery System Standards and Funding Policy Working Group are developing policy options aimed at strengthening the state’s criminal justice system, improving the outcomes of people on community supervision, and ensuring equitable distribution of resources across the state.
This overview highlights some recent criminal justice trends in Minnesota. Information presented here is based on Minnesota statutes, publicly available reports from state agencies, or federal reports.
Criminal Justice System Trends in Minnesota
Minnesota has the fifth-highest probation rate in the country.
- In 2019, Minnesota had the 5th-highest rate of people on probation in the nation, with 23 adults on probation per 1,000 adult residents.5 In contrast, Minnesota had the 5th-lowest incarceration rate in 2019, with 2 people imprisoned per 1,000 adult residents.6 In total, Minnesota’s rate of people under correctional control is 11th highest among states. (See Figure 1.)
- Other states with low incarceration rates, such as Massachusetts and Maine, maintain much lower probation rates, 42nd and 48th, respectively.7 Similarly, Wisconsin, which has a much larger prison population, has a lower correctional control rate than Minnesota—25th in the nation.
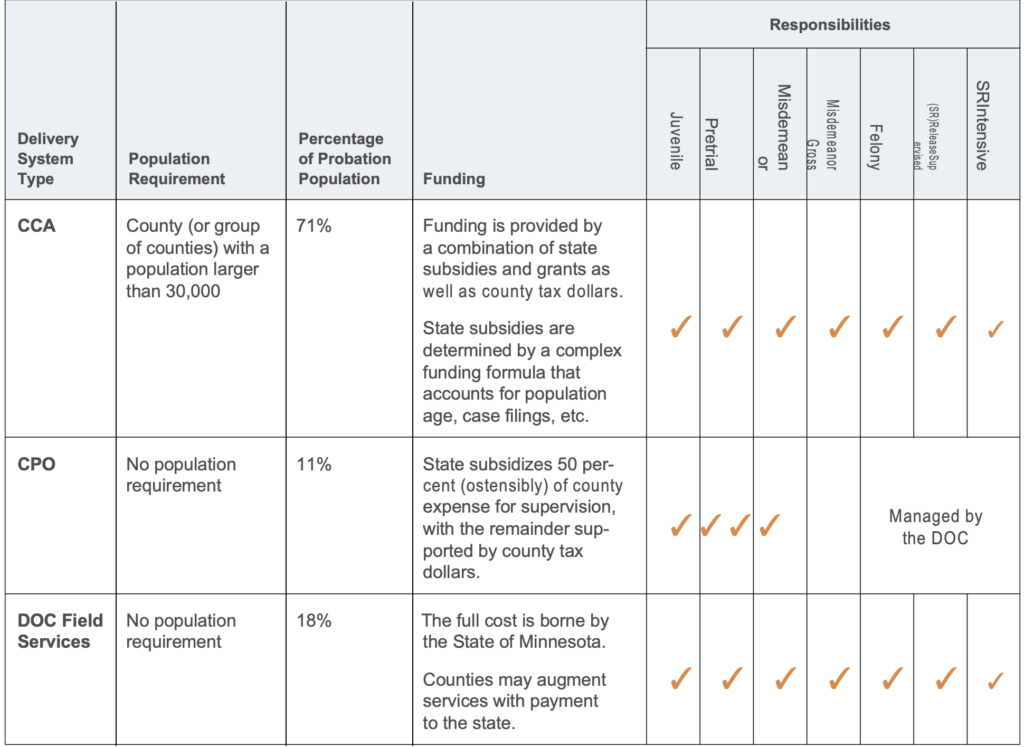
- Counties can choose from three options as to how they will participate in probation and post-incarceration supervised release and what form of funding they will receive.8 They can (1) opt to administer all correctional field services themselves according to the Minnesota Community Corrections Act (CCA); (2) supervise adults charged with misdemeanors and youth in the juvenile justice system, with the Department of Corrections (DOC) providing felony supervision, according to the County Probation Officer (CPO) model; or (3) have DOC manage the entire caseload for the county.9 Of the total probation population, 71 percent are supervised under the CCA system, 11 percent are supervised under the CPO system, and 18 percent are supervised by the DOC—over 80 percent of the probation population is supervised at the local level.10 (See Table 1).
Figure 1. National Probation and Incarceration Rates and Rates of People Under Correctional Control
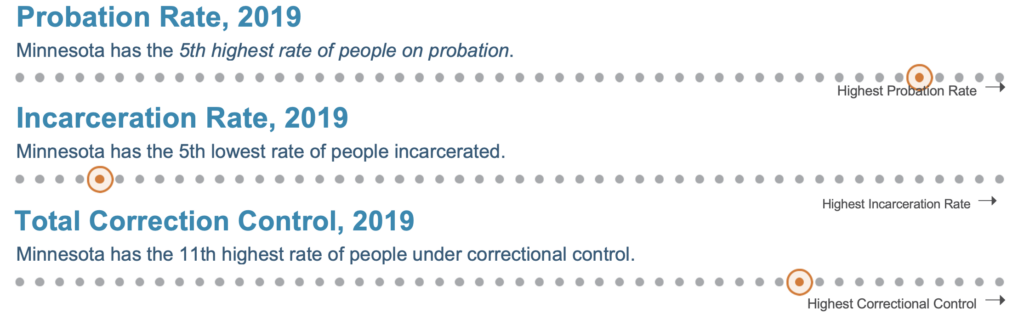
Table 1. Summary of Minnesota Probation and Post-Release Supervision Delivery Models
Sentences to probation make up about three-quarters of all felony sentences in Minnesota.
- Minnesota has limited the use of prison by following guidelines that create a presumption of probation in most cases.11 In 2019, 24 percent of sentences were to prison, while the remaining 76 percent were to probation demonstrating the state’s reliance on community supervision and the importance of having an effective and efficient supervision system.12
- Despite the high rate of sentences to community supervision, the vast majority of sentences include a period of incarceration. In 2019, 77 percent of women and 65 percent of men received incarceration in a local correctional facility (jail) as a condition of their probation.13
Black and Native American people are overrepresented in Minnesota’s probation and prison systems.
- The rate of Black adults on felony probation in 2019 was nearly 5 times higher than that of White adults on felony probation.14 For Native Americans, this rate was more than 9 times higher than for White adults.15
- Between 2015 and 2019, the number of Black adults on felony probation increased 9 percent, from 8,636 to 9,371, and the number of Native American adults on felony probation increased 13 percent, from 2,664 to 3,018.16 During the same period, the number of White adults on felony probation increased 1 percent, from 29,300 to 29,621.17
- Native Americans on probation have higher revocation rates than other racial and ethnic groups for all offense types. While the revocation rate for people on probation for property offenses who are non-Native American is, on average, 12 percent, the rate for Native Americans is almost double, at 23 percent.18
- Despite making up just 6 percent of the state’s adult population,19 Black people accounted for 37 percent of the prison population in 2019.20 Additionally, although Native Americans make up just 1 percent of the state’s adult population,21 they accounted for 9 percent of the prison population that year.22
Recent increases in the state’s supervised release population support further study of the impact of sentencing practices on supervised release.
- Minnesota uses a determinate sentencing system in which people serve two-thirds of their sentence in prison and the last one-third under supervised release in the community. The supervised release population increased 17 percent between 2015 and 2019, from 4,769 to 5,568 people.23
- During the same period, the intensive supervised release population, which is composed of high-risk people under supervision for violent or repeat sexual offenses, decreased 26 percent, from 1,168 to 866.24
- In 2020, however, both the supervised release and intensive supervised release populations increased by 8 percent and 4 percent, respectively.25
Probation violations and supervised release returns account for nearly two-thirds of prison admissions.
- In 2019, approximately 23 percent of prison admissions were the result of probation violations.26
- An average of 2,911 people in prison each day in 2019 were incarcerated as a result of a supervision violation (including probation and supervised release violations).27 Any estimates of the state’s financial burden for supervision violations do not account for the substantial local costs of jailing people who violate probation conditions.28
The prevalence of people with behavioral health and substance use conditions poses serious challenges for Minnesota’s criminal justice system.
- Approximately 90 percent of Minnesota’s prison population has been diagnosed with substance use disorders.29 In 2019, roughly 6,500 people were assessed as needing substance use treatment each year; however, the DOC is funded to treat only 1,600 incarcerated people annually. 30
- In 2017, more than 17 percent of incarcerated women were assessed as having an opioid use disorder (OUD), and 32 percent of incarcerated Native American women were assessed as having an OUD.31
- In 2019, 30 percent of men and 60 percent of women in prison used mental health services offered by the Minnesota DOC Health Services Unit.32
The Justice Reinvestment Initiative Approach
Step 1: Analyze Data and Develop Policy Options
Under the direction of the Governor’s Council on Justice Reinvestment and the Delivery System Standards and Funding Policy Working Group, CSG Justice Center staff conducted a comprehensive analysis of case-level sentencing, community corrections, and incarceration data to examine probation, supervised release, incarceration, and recidivism trends as well as the risk and needs of the supervised and incarcerated population. CSG Justice Center staff also explored how those trends relate to statutory and administrative policies, criminal justice expenditures, and the availability of treatment and programs designed to reduce recidivism. To the extent data were available, CSG Justice Center staff assessed how felony sentencing trends impact probation, supervised release, and incarcerated populations and explored contributors to recidivism trends. All analyses are being presented to help the state learn more about how race, gender, and geographic trends vary and how these factors may impact outcomes. The analyses will result in findings related to the sources of correctional population growth, high recidivism rates, and effectiveness of agency policies and procedures.
To incorporate perspectives and recommendations from across the state, CSG Justice Center staff gathered input from criminal justice system stakeholders, including judges, district attorneys, defense lawyers, sheriffs, police chiefs, probation officers and administrators, behavioral health treatment providers, victims and their advocates, people in the criminal justice system and their advocates, Tribal leaders, residents and leaders in communities where confidence in the criminal justice system may be low, local officials, and others.
With guidance from the Governor’s Council on Justice Reinvestment and the Delivery System Standards and Funding Policy Working Group, CSG Justice Center staff are reviewing the analyses and developing data-driven policy options focused on improving the efficacy and equity of resources for community supervision, reducing recidivism, addressing the behavioral health needs of people in the criminal justice system, strengthening victim support and resources, and allowing the state to track the returns on public investment.
Specifically, HF 63 charges the Delivery System Standards and Funding Policy Working Group with identifying pathways for how the state and counties can achieve an effective supervision system together, balancing local control with state support and collaboration. They must identify the following:
- A proposal for sustainable funding of the state’s community supervision delivery system.
- A plan for the potential of future Tribal government supervision of people on probation and supervised release.
- A definition of core or base-level supervision standards in accordance with the state’s obligation to fund or provide supervision services that are geographically equitable and reflect the principles of modern correctional practice.
- A recommended funding model and the associated costs as compared to the state’s current investment in those services
- Alternative funding and delivery models and the alternative models’ associated costs when compared with the state’s current investment in those services
- Mechanisms to ensure a balanced application of increases in the cost of community supervision services
Policy options will be available for the Governor’s Council on Justice Reinvestment’s and the Delivery System Standards and Funding Policy Working Group’s consideration in early 2022, and approved recommendations will then be provided to the legislature.
Step 2: Adopt New Policies and Put Reinvestment Strategies Into Place
If the policy options are adopted, Minnesota state leaders will have the opportunity to request continued assistance from the CSG Justice Center. If the request is approved, CSG Justice Center staff will work with Minnesota policymakers to translate the new policies into practice. This assistance will help ensure that related programs and system investments achieve projected outcomes and are implemented with fidelity. CSG Justice Center staff will develop implementation plans with state and local officials and provide policymakers with frequent progress reports.
Step 3: Measure Performance
Finally, CSG Justice Center staff will help Minnesota officials improve statewide data collection and sharing to measure and monitor performance as well as, ultimately, increase the state’s capacity for making data-driven decisions in criminal justice policymaking and budgeting. This could include identifying key data points to record and officials who are best positioned to collect data, as well as exploring best practices to track, monitor, share, and analyze data. Improvements in this area will allow state leaders to assess the impact of enacted policies on pretrial, probation, postrelease supervision, and incarcerated populations, including recidivism rates, and develop strategies to monitor these outcomes.
Endnotes
- Minnesota Sentencing Guidelines Commission, 2021 Report to the Legislature (Saint Paul, MN: Minnesota Sentencing Guidelines Commission,2021), https://mn.gov/sentencing-guidelines/assets/2021MinnSentencingGuidelinesCommReportLegislature_tcm30463260.pdf.
- Todd D. Minton, Lauren G. Beatty, and Zhen Zeng, Ph.D., Correctional Populations in the United States, 2019– Statistical Tables (Washington, DC:Office of Justice Programs Bureau of Justice Statistics, July 2021); Minnesota Department of Corrections, Adult Prison Population Summary (St. Paul, MN: Minnesota Department of Corrections, January 2020); Minnesota Department of Corrections, 2019 Probation Survey (St. Paul, MN: Minnesota Department of Corrections, April 2020); CSG Justice Center analysis of MN DOC supervised release data.
- “Current Estimates of State Budget,” Minnesota Management and Budget, accessed February 15, 2021, https://mn.gov/mmb/budget/state-budget-overview/current-estimates/.
- SF 878, 89th Senate Reg. Sess. (MN 2015) (the most recent amendment to the Community Corrections Act formula).
- Barbara Oudekerk and Danielle Kaeble, Probation and Parole in the United States, 2019 (Washington, DC: Bureau of Justice Statistics, 2021). In 2019,the reported rate was 2,427 per 100,000 adults.
- Bureau of Justice Statistics, Prisoners in 2017–2019 (Washington, DC: United States Department of Justice, 2018–2020). The year 2019 is the most recent published by BJS. In 2019, the adult incarceration rate was 229 per 100,000 adults, or 2.2 per 1000 adults.
- Bureau of Justice Statistics, Probation and Parole, 2019.
- “About MACCAC,” Minnesota Association of Community Corrections Act Counties – MACCAC, accessed March 27, 2020, http://www.maccac.org.
- Ibid.
- Minnesota Department of Corrections, Probation Survey, 2019.
- Minnesota Sentencing Guidelines Commission, 2019 Sentencing Practices (St. Paul, MN: Minnesota Sentencing Guidelines Commission, 2020).
- Ibid.
- Ibid.
- Minnesota Department of Corrections, Probation Survey, 2019.
- Ibid.
- Minnesota Department of Corrections, Probation Survey, 2019.
- Ibid
- Minnesota Sentencing Guidelines Commission, 2019 Probation Revocations (St. Paul, MN: Minnesota Sentencing Guidelines Commission, 2020), https://mn.gov/msgc-stat/documents/reports/2019/2019MSGCRe-portProbationRevocations.pdf.
- “Explore Census Data,” United States Census Bureau, accessed March 8, 2021, https://data.census.gov; Minnesota Department of Corrections, Adult Prison Population Summary, 2019.
- Minnesota Department of Corrections, Adult Prison Population Summary, 2019.
- “Explore Census Data,” United States Census Bureau, accessed March 8, 2021, https://data.census.gov; Minnesota Department of Corrections, Adult Prison Population Summary, 2019.
- Minnesota Department of Corrections, Adult Prison Population Summary, 2019.
- Minnesota Department of Corrections, Probation Survey, 2019.
- Ibid.
- Minnesota Department of Corrections, Probation Survey, 2020.
- “Minnesota: Supervision Violation Data Snapshot” from More Community, Less Confinement, CSG Justice Center, 2021, https://csgjusticecenter.org/publications/more-community-less-confinement/50-state-reports/?usState=MN.
- Ibid.
- Ibid.
- Substance Use Disorder Treatment Services in Prison (Minnesota: Minnesota Department of Corrections, 2019).
- Ibid.
- CSG Justice Center communication with Minnesota state officials, May 14, 2019.
- Mental Health Services (Minnesota: Minnesota Department of Corrections, 2019), https://mn.gov/doc/assets/Mental%20Health%20Services_tcm1089-489585.pdf.
This project was supported by Grant No. 2019-ZB-BX-K002 awarded by the Bureau of Justice Assistance. The Bureau of Justice Assistance is a component of the Department of Justice’s Office of Justice Programs, which also includes the Bureau of Justice Statistics, the National Institute of Justice, the Office of Juvenile Justice and Delinquency Prevention, the Office for Victims of Crime, and the SMART Office. Points of view or opinions in this document are those of the author and do not necessarily represent the official position or policies of the U.S. Department of Justice.
The Council of State Governments (CSG) Justice Center is a national nonprofit organization that serves policymakers at the local, state, and federal levels from all branches of government. The CSG Justice Center’s work in justice reinvestment is done in partnership with The Pew Charitable Trusts and the U.S. Department of Justice’s Bureau of Justice Assistance. These efforts have provided data-driven analyses and policy options to policymakers in 26 states. For additional information about Justice Reinvestment, please visit csgjusticecenter.org/jr/.

Research and analysis described in this report has been funded in part by The Pew Charitable Trusts public safety performance project. Launched in 2006 as a project of the Pew Center on the States, the public safety performance project seeks to help states advance fiscally sound, data-driven policies and practices in sentencing and corrections that protect public safety, hold people accountable, and control corrections costs. To learn more about the project, please visit pewtrusts.org/publicsafety.
Project Contact:
Michelle Rodriguez, Project Manager, mrodriguez@csg.org