Technical Appendix
Table of Contents
Quantitative Data Sources
CSG Justice Center staff obtained data from two main sources for this project. The first source was the Montana Judiciary, which provided court records from criminal offenses and violations, and is described in detail in the accompanying report on missing data, Availability of Defendants’ Race and Ethnicity Information in Montana’s Case Management System. The second source was the MT DOC, which provided records of prison, probation, and parole admissions and release. These two data sources were the main ones used for analysis presented in this report. CSG Justice Center staff additionally obtained U.S. Census Bureau data for select calculations.
Montana Department of Corrections
As noted earlier, due to the amount of missing race and ethnicity information in court data, the primary data for this analysis came from the MT DOC Offender Management Information System (OMIS). Staff from the Statistics and Data Quality Unit extracted and shared information about people convicted of felonies between January 1, 2016, and July 14, 2021. For all people in this cohort, we received criminal history, which in OMIS includes approximately 10 years of felony conviction information.53 There were 94,924 offenses recorded in OMIS for this cohort. CSG Justice Center staff used the offense data to construct samples for our sentencing decision and length analyses.
In addition to felony offenses, CSG Justice Center staff also received OMIS correctional status records. These data provide a timeline of individuals involved in the Montana criminal justice system and include start and end dates for when people are incarcerated in secure and alt-secure facilities or on probation, conditional release, or parole. CSG Justice Center staff used the correctional status data to construct samples for length of stay and supervision revocation analyses. CSG Justice Center staff constructed each analytic sample used in regression analysis from the MT DOC OMIS data. All analytic samples include only people identified as White or American Indian. As described in the Analytic Approach section above (see pp. 7–10), the number of people of other races or ethnicities was too small for statistical analysis.
U.S. Census Bureau
CSG Justice Center staff obtained publicly available data from the U.S. Census Bureau’s American Community Survey. Specifically, the 2019 one-year Public Use Microdata Sample54 was used to tabulate the number of non-Hispanic American Indian and White people aged 17 and older living in Montana. This information was used to calculate select descriptive statistics (specifically, statistics presented in Fig. 1 on p. 6) and was not used in regression analyses.
Incarceration Sentence and Placement Decisions
Analytic Samples
Analytic Sample 1: Incarceration “In-Out” Decision
CSG Justice Center staff limited the first analytic sample to felony convictions that were pronounced (i.e., sentenced) between January 1, 2016, and December 31, 2020. Even though the data received included some convictions from earlier than 2016, only 2016–2020 data included all felony convictions in the respective calendar year. Additionally, probation violation sentences were excluded from the analytic sample because it was not possible to link violation sentences to their original sentences. In sum, the first analytic sample includes only original felony sentences.
When a person had two or more felony convictions that were sentenced on the same day, all those sentences were bundled together into a single “sentencing event.” To calculate the total sentence length from a sentence event, sentence lengths across the multiple offenses were summed (as long as the sentences were not indicated to run concurrently). Additionally, if there was more than one offense type in a single sentence event (e.g., drug and property offenses), the offenses with the longest maximum prison sentence were preferred in selecting the controlling offense type used in regression models.
An additional 1,191 cases (about 6.5 percent of the 18,215 cases identified through initial data cleaning) were excluded because they were missing values for key measures used in the regression analysis. Finally, 94 remaining cases were excluded because they were transferred to the Department of Public Health and Human Services (DPHSS). This resulted in a sample of 16,930 total cases (analytic sample 1).
Note that the felony conviction sample is composed of two distinct components: a total of 6,908 people whose placement decision (e.g., prison vs. probation) was made by a judge and a total of 10,022 people whose placement decision was made by the MT DOC (which occurs in cases where the judge sentences the person to “DOC commit” status). In the body of this report, results for two component parts are reported separately.
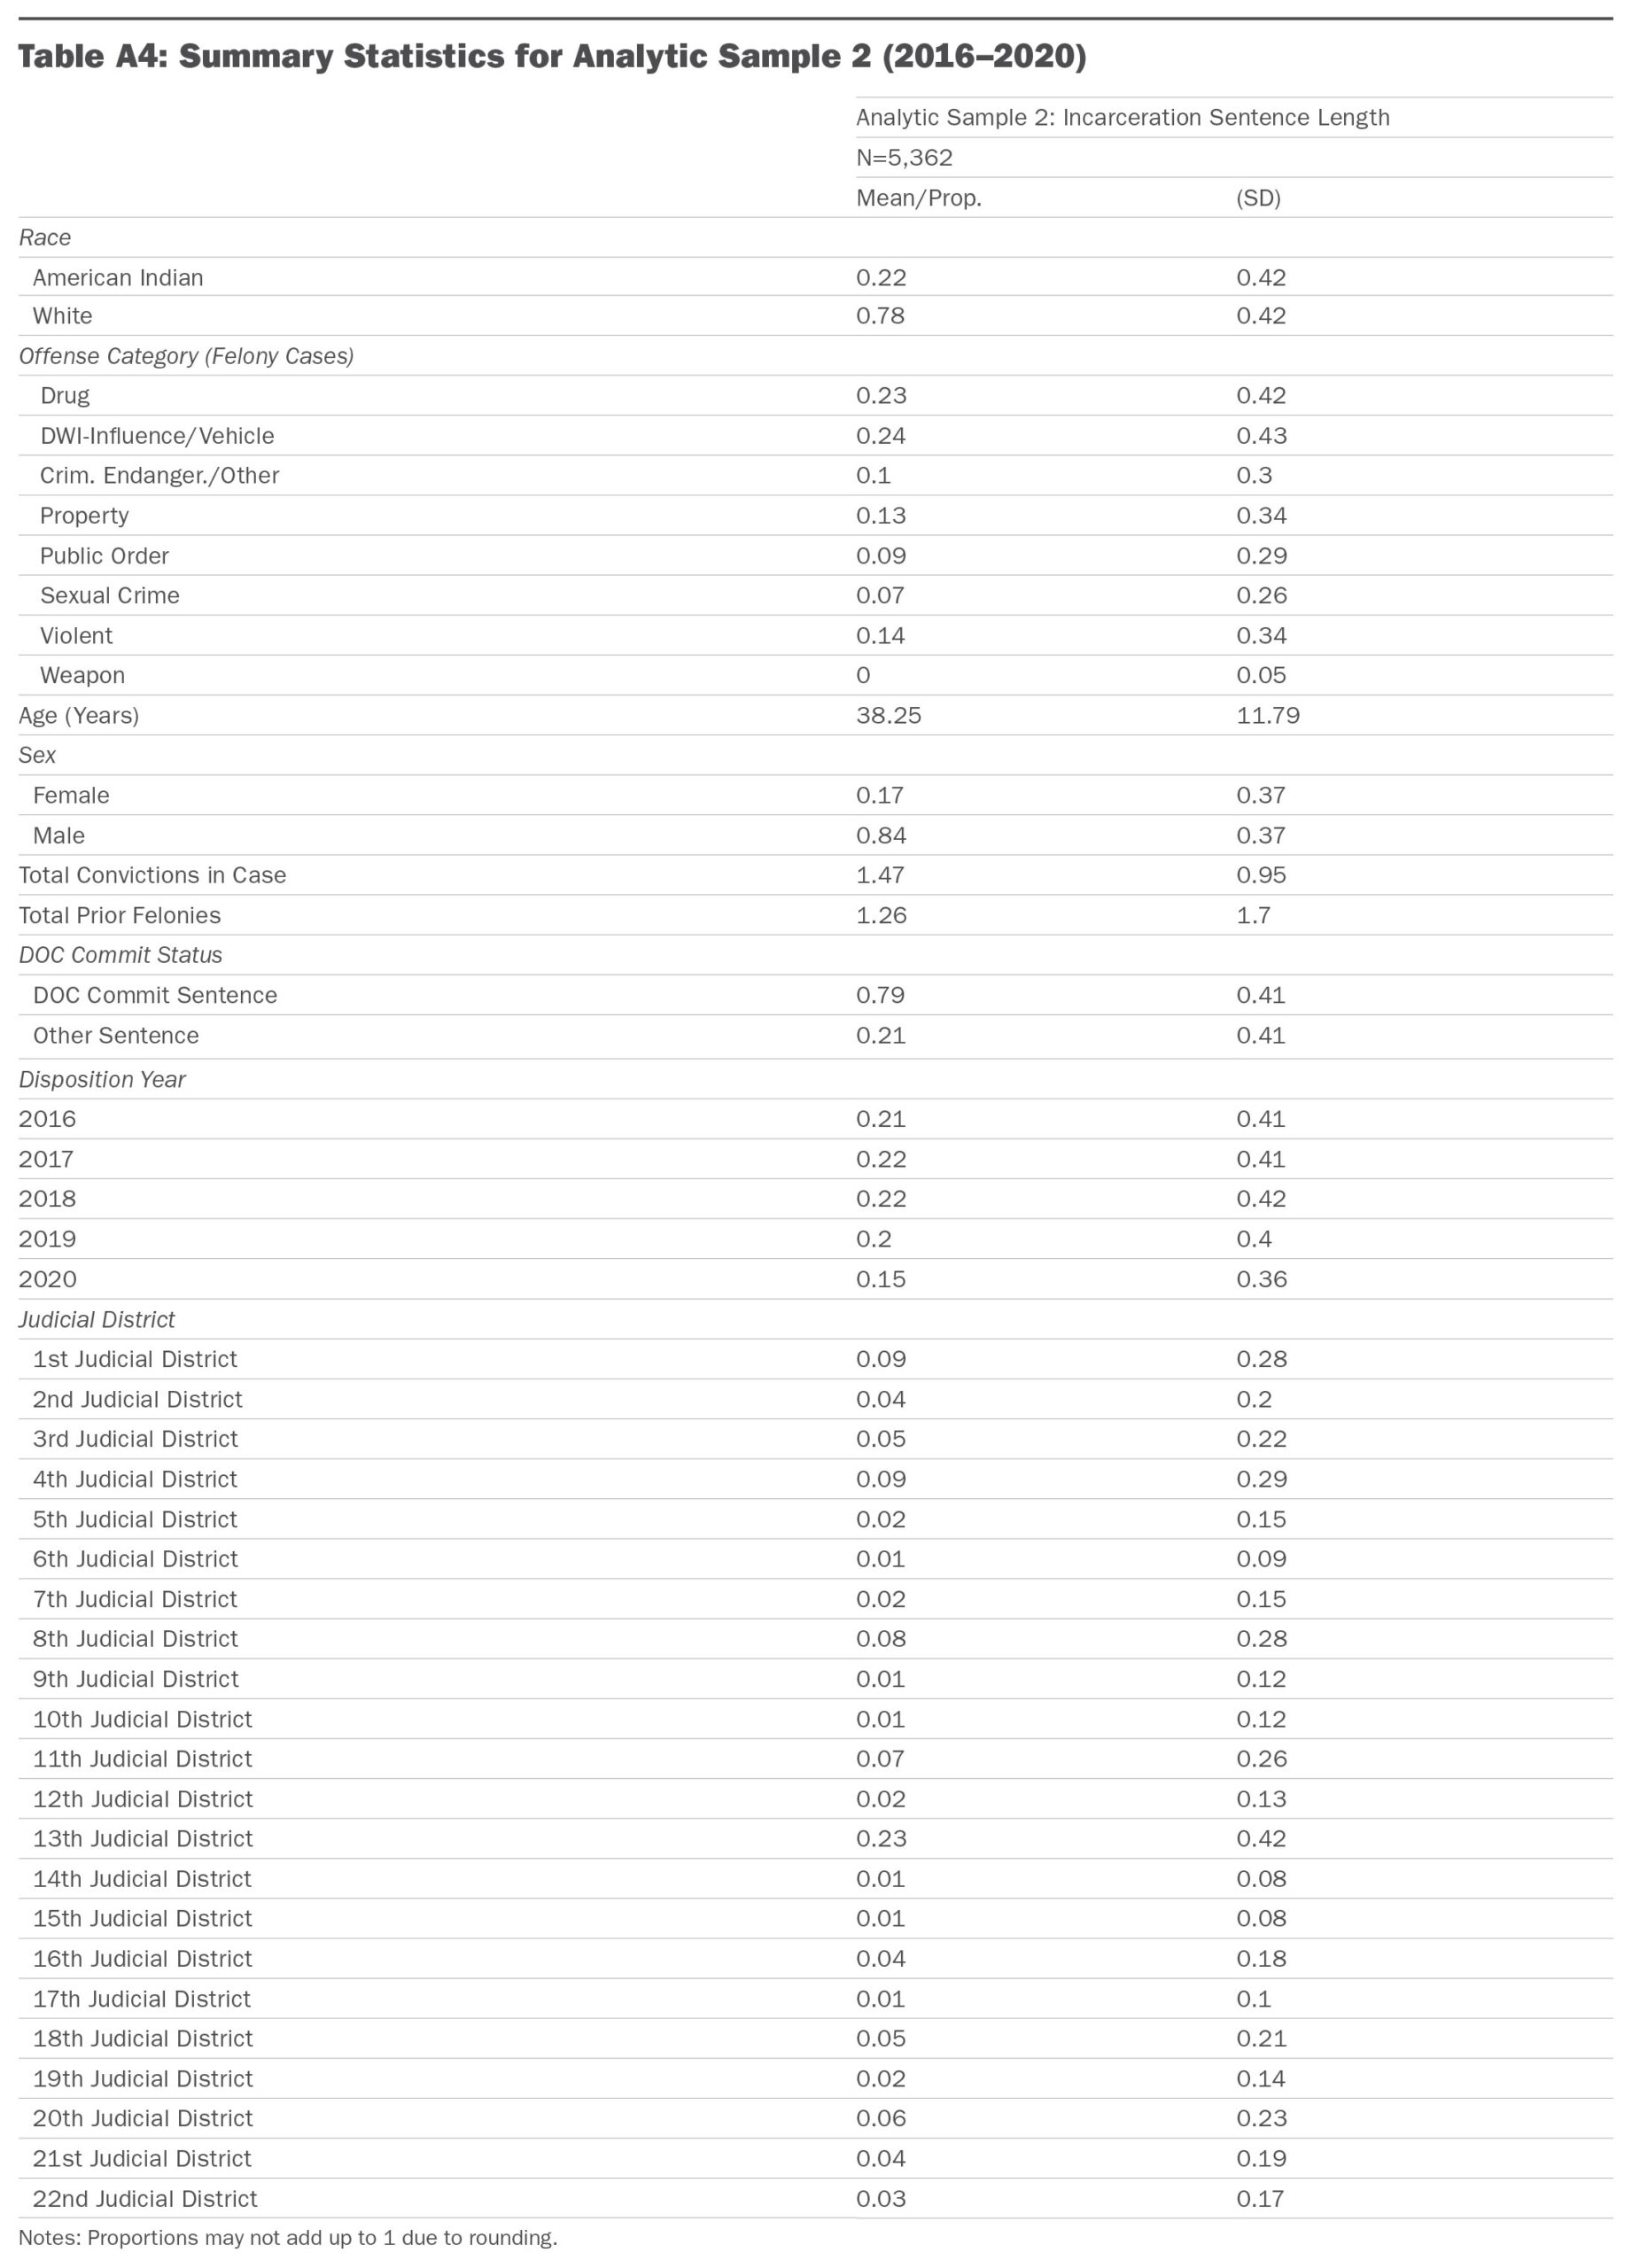
Analytic Sample 2: Incarceration Sentence Length
Starting with the 16,930 cases in analytic sample 1, CSG Justice Center staff further subdivided these data to develop an analytic sample for incarceration sentence length analysis. Because incarceration sentence length was relevant in only a subset of the 16,930 cases, regression analysis for this second dependent variable was restricted to the 5,362 cases for which incarceration was imposed and for which comprehensive data on total sentenced prison days were available. For example, in some cases, CSG Justice Center staff could not reliably calculate total prison days for the focal case because the prison sentence was set to run consecutively to an existing sentence, which CSG Justice Center staff were unable to identify due to data limitations.
Regression Analysis
Regression analysis was employed to investigate the extent to which racial disparities were present at key sentencing and placement decision-making points after accounting for case and individual characteristics.
Regression Analysis: Measures
CSG Justice Center staff constructed dependent (outcome) variables, as well as independent and control variables, using analytic samples 1 and 2.
Dependent Variables
The first dependent variable is incarceration, a binary variable indicating whether a sentence (or placement via DOC) to “straight” incarceration or a split sentence (i.e., including both incarceration and probation) was imposed in the case. As described above, there were 16,930 cases in this group (analytic sample 1: felony convictions); these are the cases used to examine likelihood of incarceration. The second dependent variable is incarceration sentence length, a measure of the number of prison days sentenced in a case. As noted above, there were 5,362 cases in this group (analytic sample 2: felony convictions resulting in incarceration).
Independent and Control Variables
The same set of independent and control variables was used to analyze both incarceration and incarceration sentence length outcomes. The main independent variable is the race of the person convicted of a felony crime; this is a binary variable indicating whether the person is identified as American Indian or White in MT DOC records. Additionally, there were two sets of control variables constructed to account for key case and individual characteristics, respectively.
In terms of case characteristics, the first control variable is offense category/type, which documents the most serious felony conviction in the case (sometimes termed the controlling or governing offense). To categorize offenses, CSG Justice Center staff used a typology of offenses provided by MT DOC to develop the following eight offense categories: influence (e.g., DWI), public order, criminal endangerment and other person, violent, sexual crime, weapon, property, and drug crimes. In cases where there were convictions for more than one offense and offenses fell into more than one crime category (e.g., one drug conviction and one influence conviction), CSG Justice Center staff used the offense with the longest maximum prison sentence54 to categorize the case. Control variables were also constructed for total convictions in a case (this variable was log transformed to account for a skewed distribution), the case disposition year, and the corresponding judicial district.
Regarding individual characteristics, in addition to race, demographic information included a binary variable for sex (female or male); a count variable for age at the time of case sentencing; and in-state criminal history, a count variable defined as the total number of prior felony convictions in approximately the 10 years prior, as recorded by MT DOC (this variable was log transformed to account for a skewed distribution).
Regression Analysis: Summary Statistics
Means and proportions for the dependent variables are shown in Tables A1–2 below; means and proportions for the independent and controls variables are summarized in Table A3–4.


Regression Analysis: Results
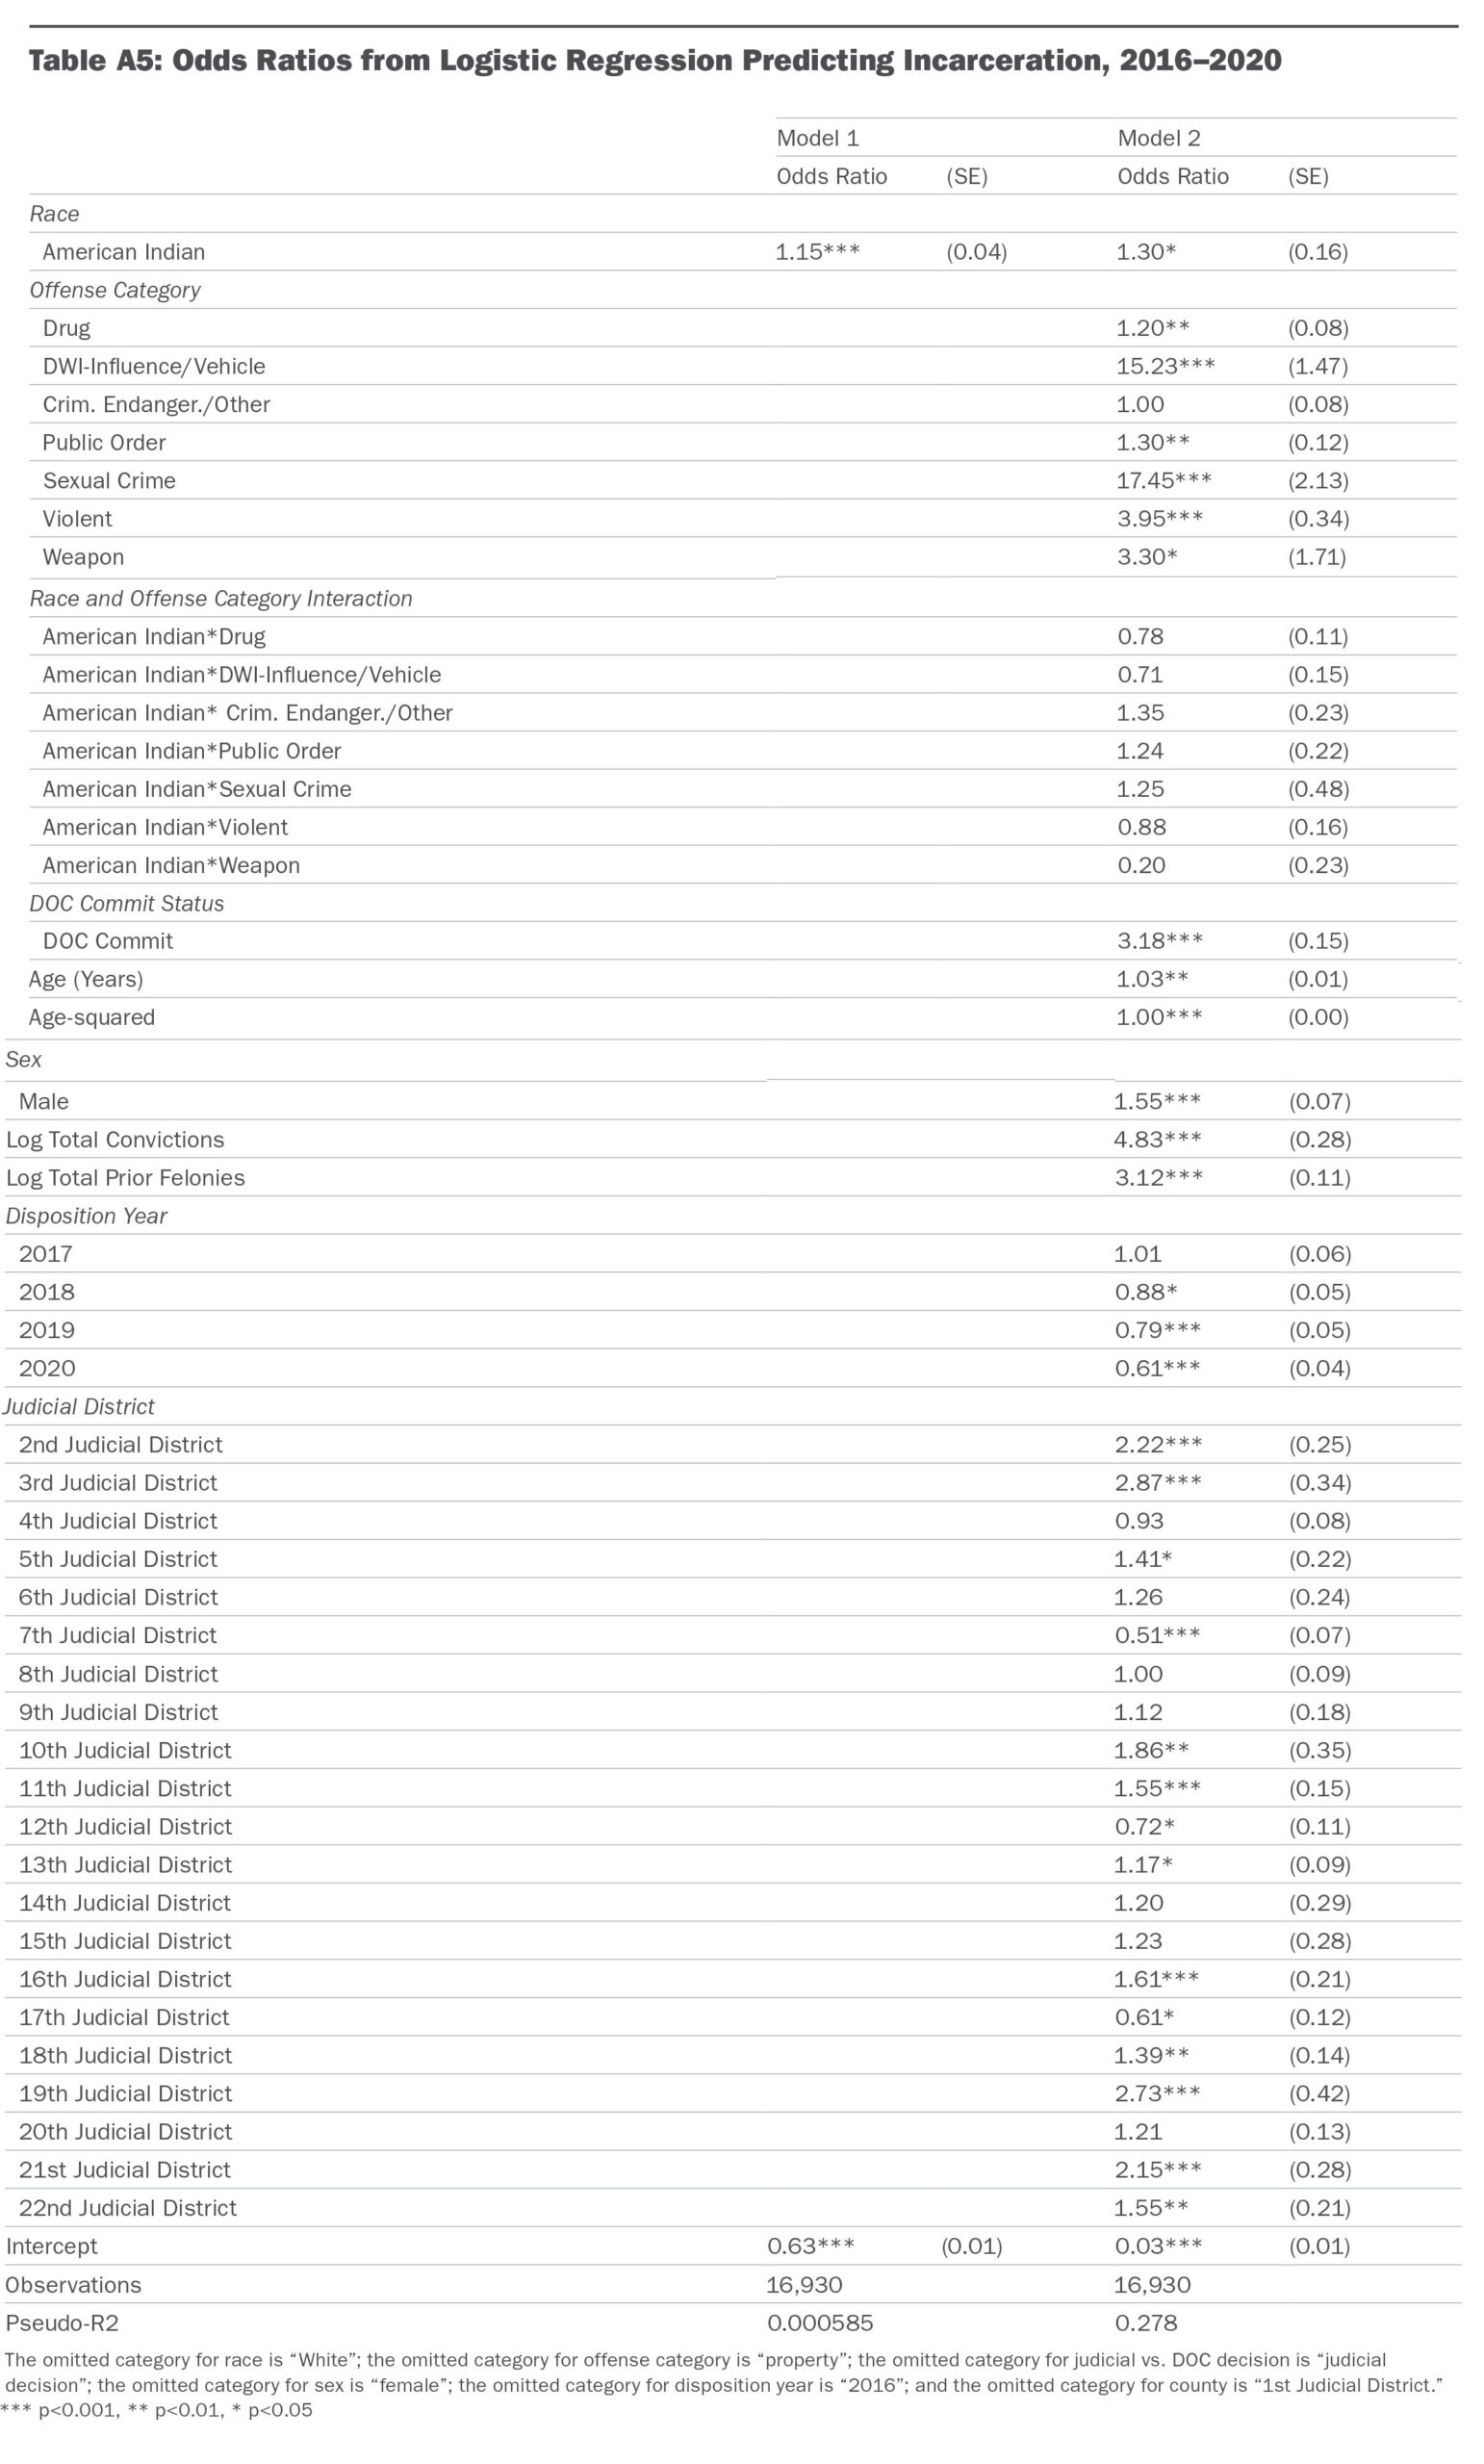
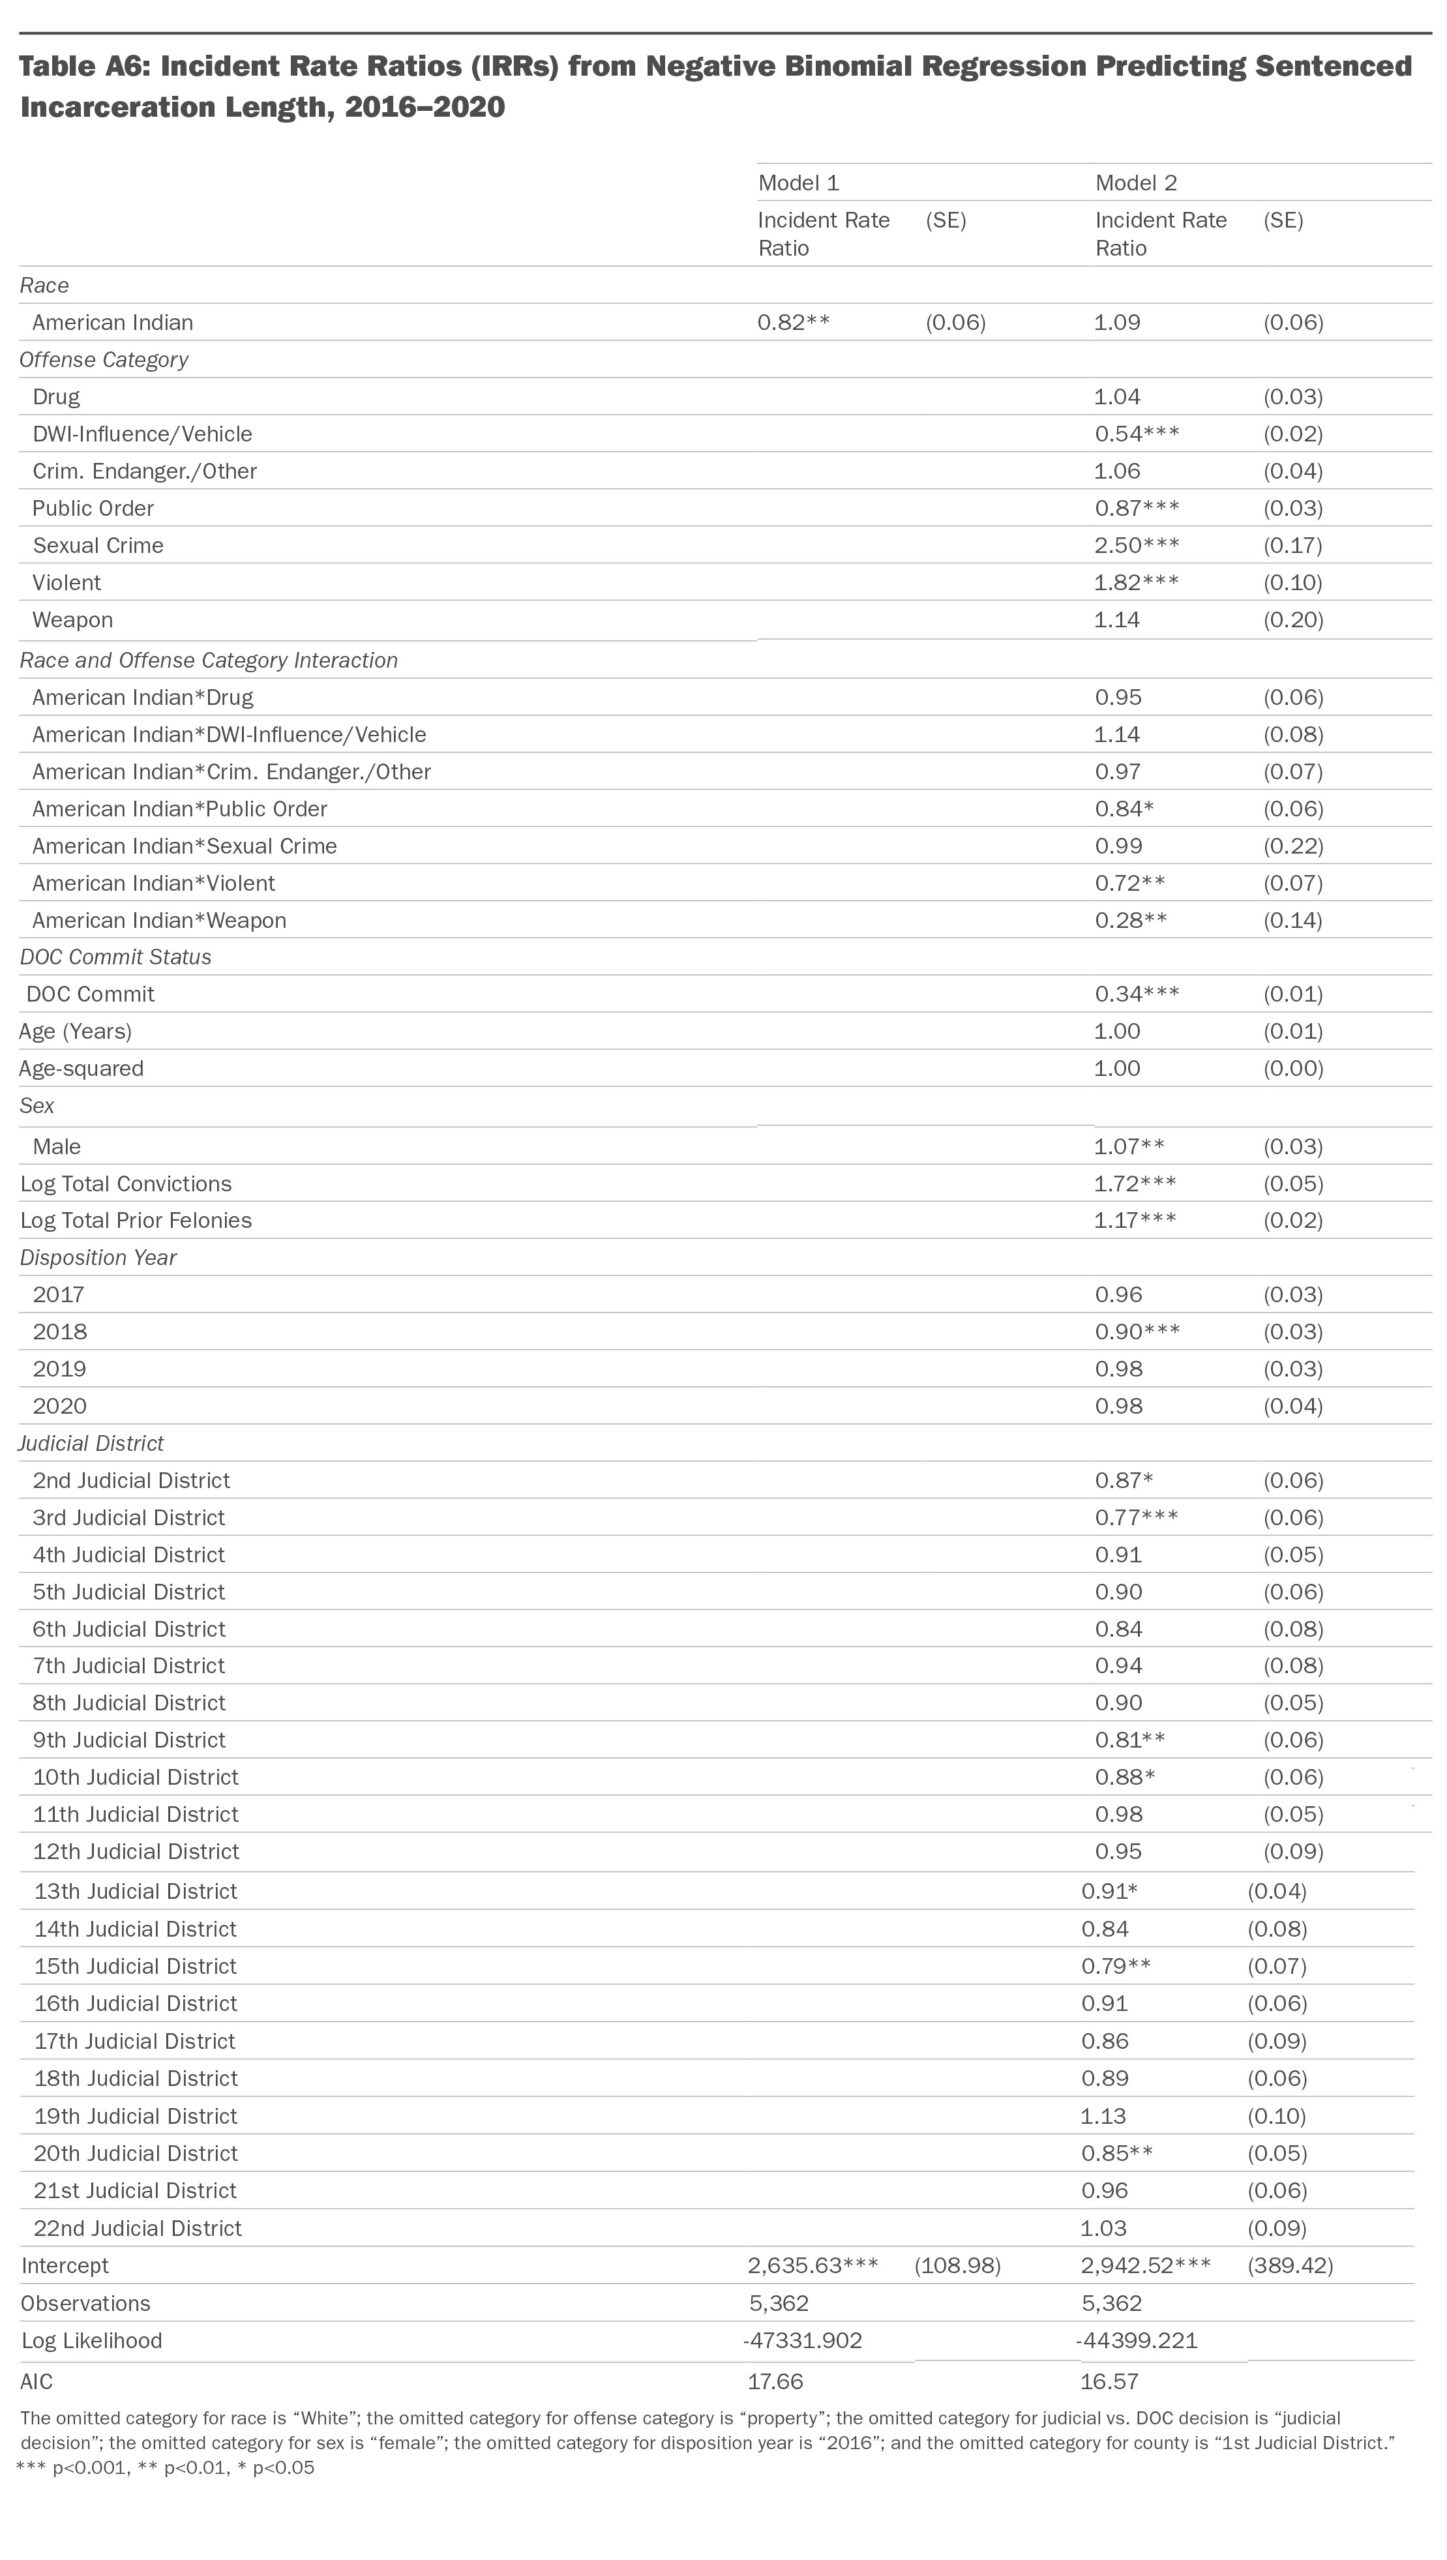
Regression analysis was used to examine the extent to which there are racial disparities in the decision to incarcerate, as well as incarceration sentence length, after accounting for case and defendant characteristics. For likelihood of incarceration, a binary variable, logistic regression was used. Negative binomial regression was used to analyze incarceration sentence length, the second outcome, because it is an over-dispersed count variable.
Table A5 is a summary of results from regression analyses examining the likelihood of incarceration. Note that the regression model examining the likelihood of incarceration combined judicial and MT DOC cases; that is, regressions were run for the full analytic sample including all 16,930 cases. As described below, results shown in the main body of the report, separated for judicial vs. MT DOC decisions, were estimated using predicted probabilities from this main regression model.
Table A6 summarizes results from regression analyses examining incarceration sentence length. In the main body of the report, adjusted results depicted in Figures 5–6 were obtained by using fully adjusted regression models to estimate predicted outcomes (i.e., the predicted probability of incarceration and predicted incarceration sentence length). For the incarceration outcome, to calculate the adjusted relative rate index results that are depicted in Figures 5–6 (in the main body of the report), fully adjusted regression models were used to obtain predicted probability of incarceration for each offense category (e.g., drug, public order offenses) by racial group and were then further grouped by the relevant decision-making authority (i.e., judicial sentence to incarceration vs. MT DOC placement). Relative rate indices were then calculated using those outputs.
Length of Stay
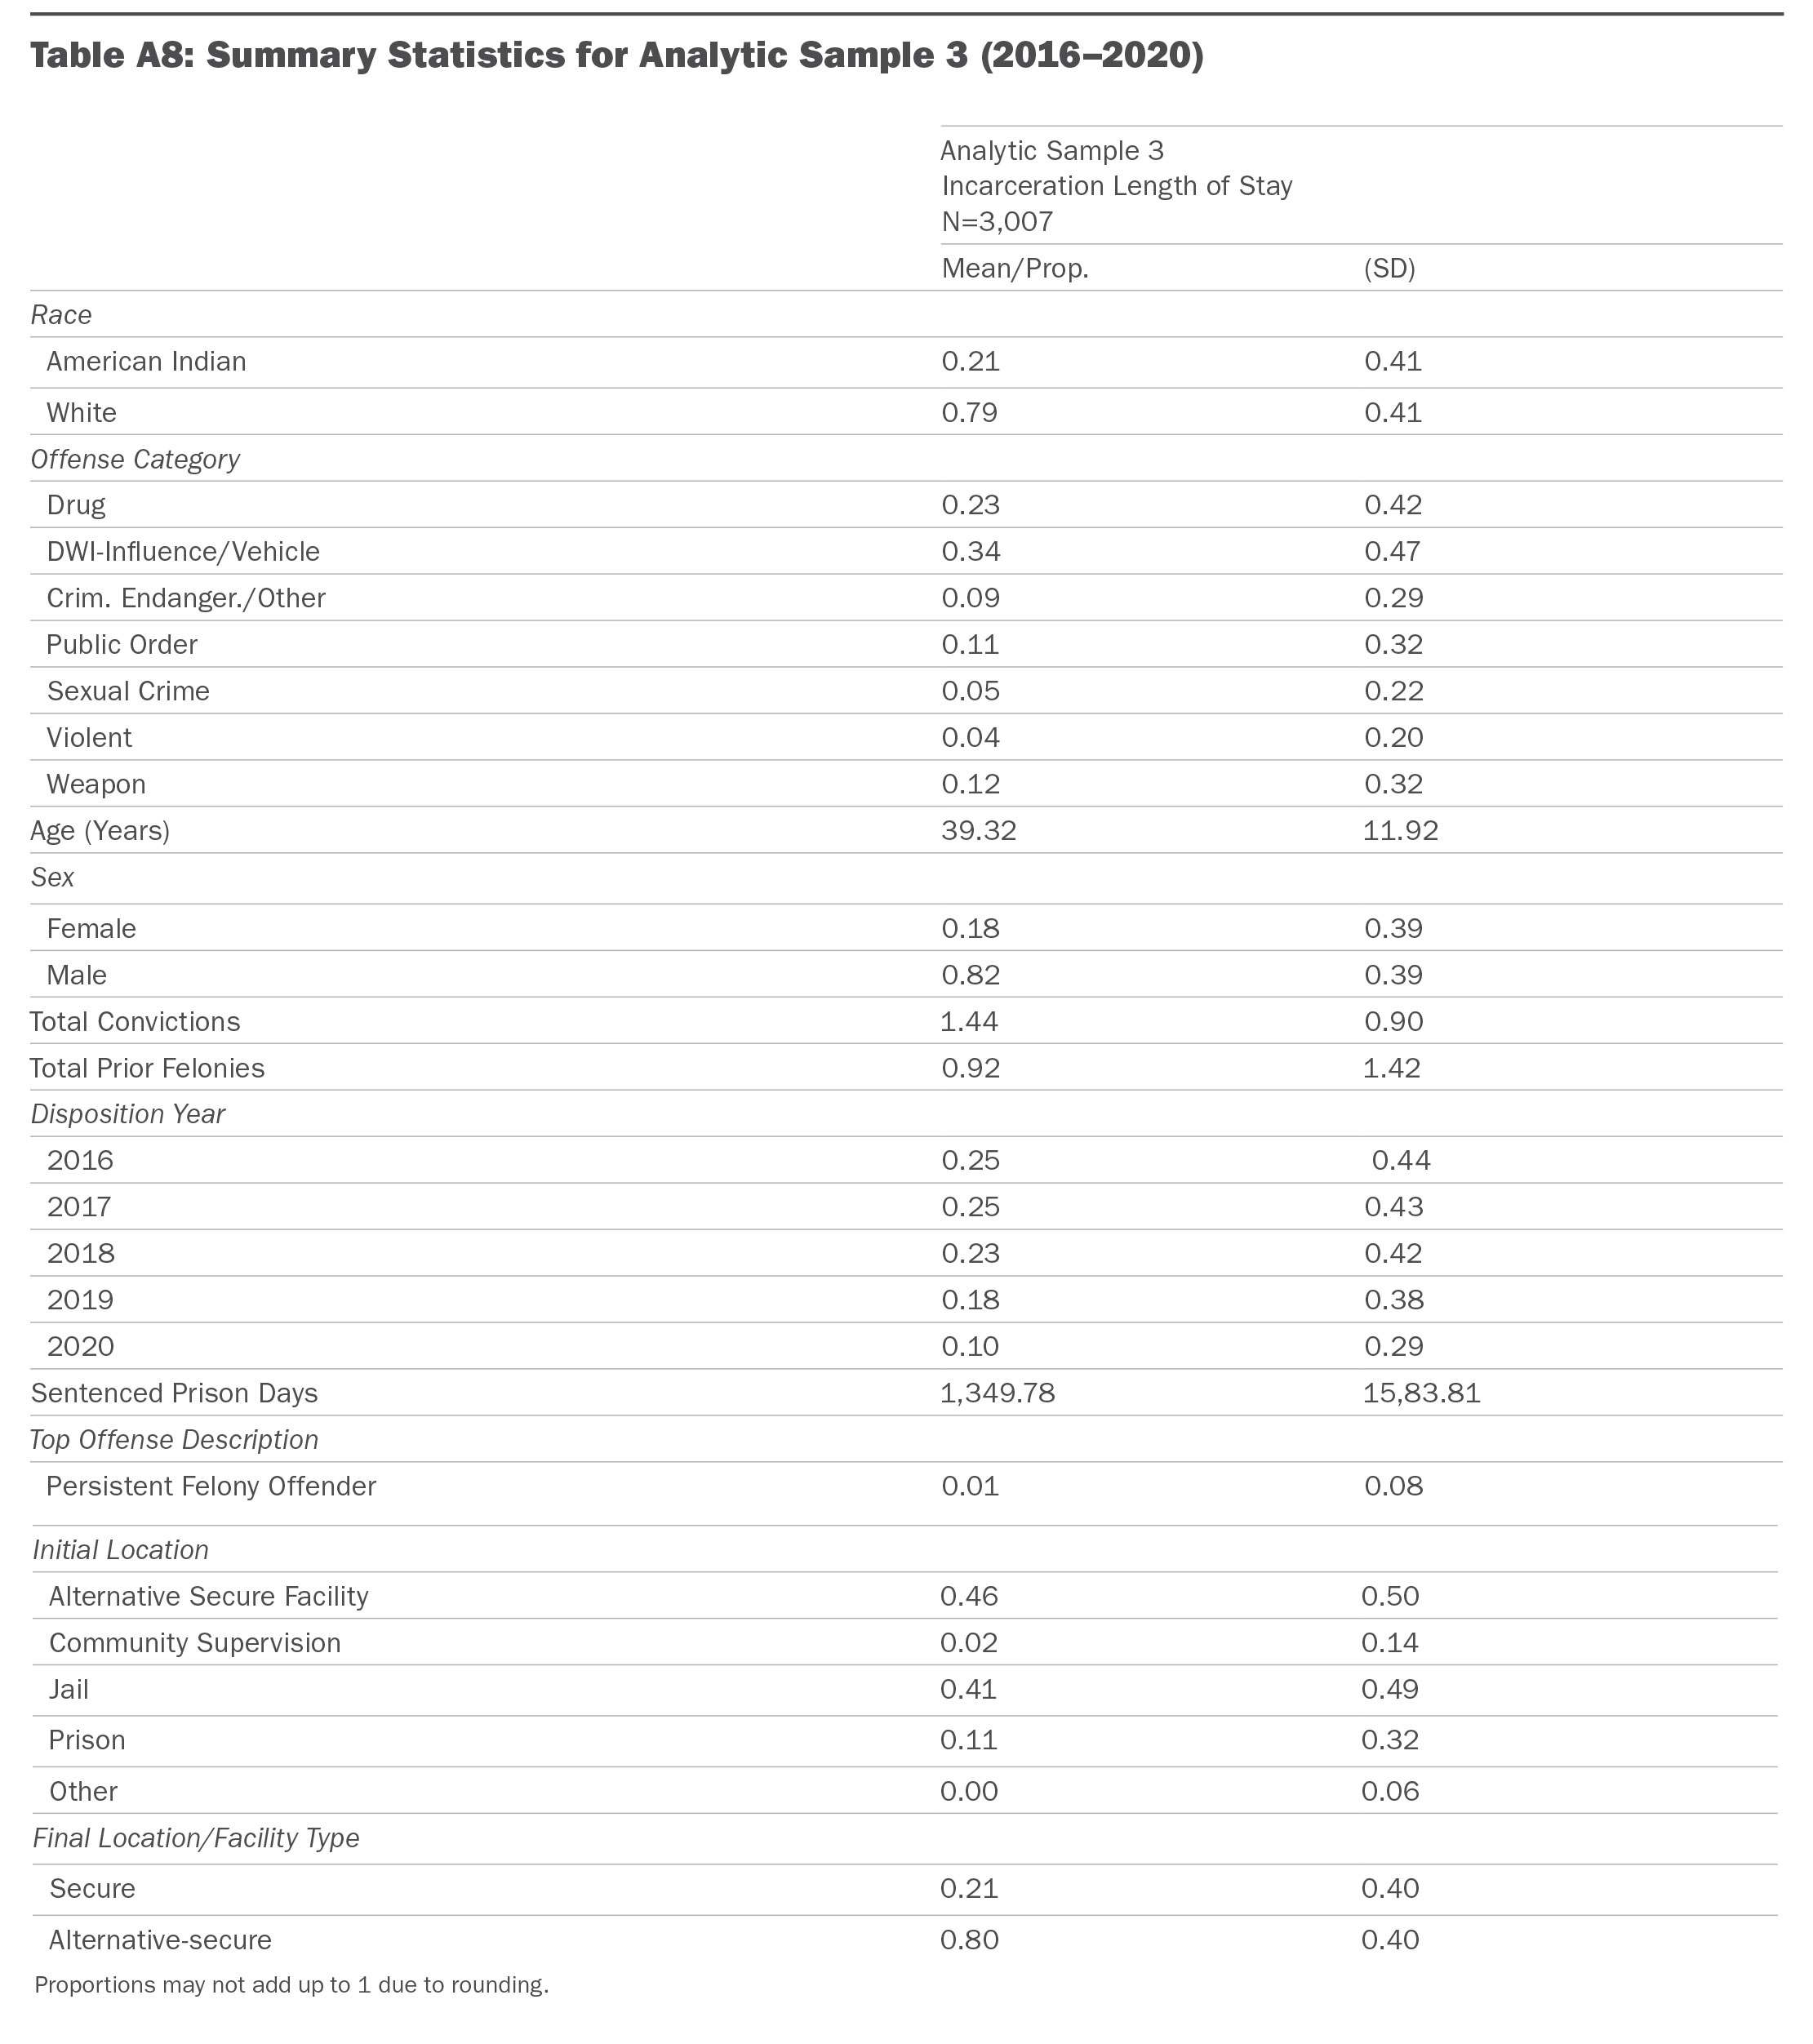
Analytic Sample 3: Incarceration Length of Stay
The third analytic sample, for length of stay in Montana State Prison, Montana Women’s Prison, or an alternative secure facility, was constructed by combining the felony conviction sample described above (analytic sample 2) with correctional status data. First, all sentencing events in which the pronounced sentence included at least one day of prison were identified; second, these records were matched to the beginning of a secure or alt-secure placement in the correctional status data. To calculate length of stay, confinement windows were calculated and defined as consecutive secure or alt-secure placements. The total length of stay is the number of total days in each window. People who received another sentence during their confinement window were excluded, because in those cases, it was not possible to attribute the length of stay to a single sentencing event. After initial data cleaning, a total of 3,294 cases were identified. An additional 287 cases were excluded because values for key variables used in regression analysis were missing; the final analytic sample included 3,007 cases.
Regression Analysis
Regression analysis was employed to investigate the extent to which racial disparities were present at incarceration length of stay after accounting for contextual and individual characteristics.
Regression Analysis: Measures
CSG Justice Center staff constructed the dependent (outcome) variable and independent and control variables using analytic sample 3.
Dependent Variable
The dependent variable for this analysis is incarceration length of stay, a measure of the number of consecutive prison days served as part of a sentence for a felony conviction.
Independent and Control Variables
The independent and control variables used to analyze incarceration length of stay are very similar to those used in the analysis of incarceration sentencing and placement. The main independent variable is the race of the person convicted of a felony crime; this is a binary variable indicating whether the person is identified as American Indian or White in MT DOC records. Additionally, there were two sets of control variables constructed to account for both key contextual and individual characteristics, respectively.
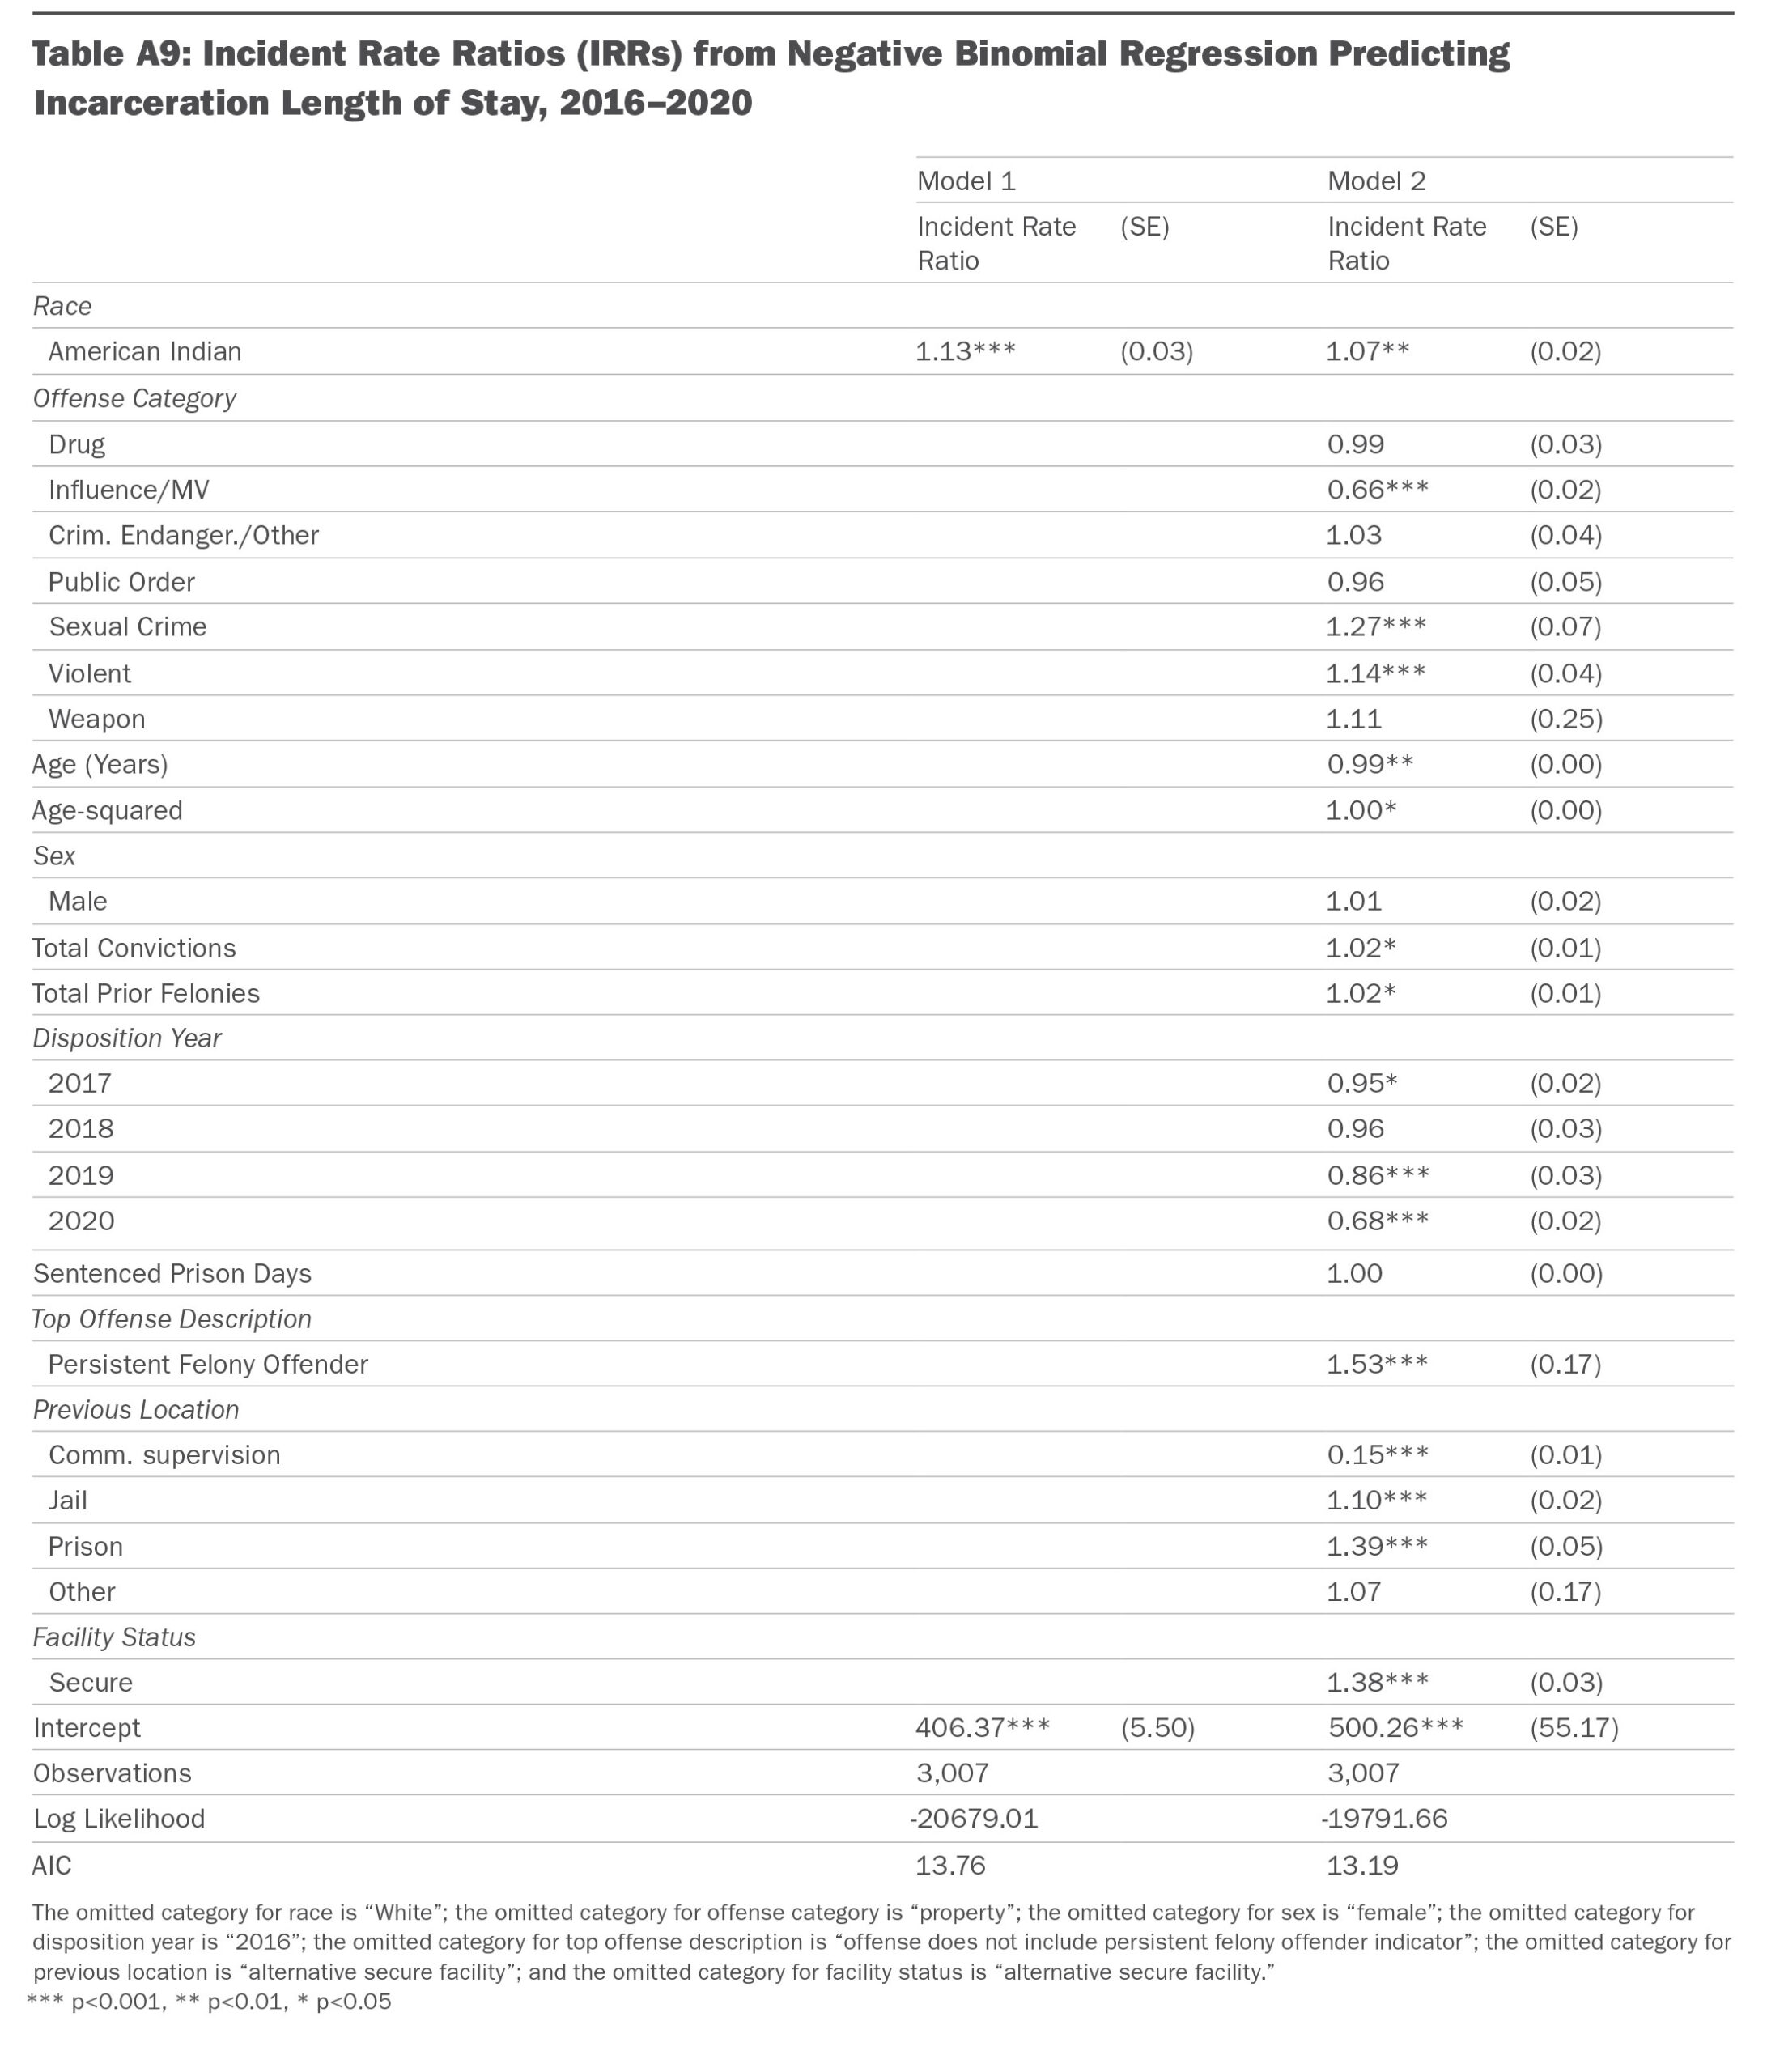
In terms of contextual characteristics, the first control variable is offense category/type, which documents the most serious felony conviction in the case (sometimes termed the controlling or governing offense). To categorize offenses, CSG Justice Center staff used a typology of offenses provided by MT DOC to develop the following eight offense categories: influence (e.g., DWI), public order, criminal endangerment and other person, violent, sexual crime, weapon, property, and drug crimes. In cases where there were convictions for more than one offense and offenses fell into more than one crime category (e.g., one drug conviction and one influence conviction), CSG Justice Center staff used the offense with the longest maximum prison sentence to categorize the case.55 Control variables were also constructed for total convictions in a case; the case disposition year; and sentenced prison days, a count variable. Additionally, an indicator variable was constructed for the initial location, which refers to the location or facility type where the person was placed initially post-sentencing. Possible locations included an alternative secure facility, jail, prison, and community supervision. Finally, a control for secure versus alternative secure status was constructed. To determine this status, CSG Justice Center staff examined the final correctional status that was recorded prior to release. Although people can be moved between secure and alternative secure facilities during their incarceration term, the last correctional status is a good indicator of where a person spent most of their time incarcerated. Specifically, among people whose final correctional status is a secure facility, on average about 87 percent of their term was served in prison. Among those whose final correctional status is an alternative secure facility, about 90 percent of individuals spent no days in prison; that is, in the vast majority of cases, their entire term was served in an alternative secure facility.
Regarding individual characteristics, in addition to race, demographic information included a binary variable for sex (female or male); a count variable for age at the time of case sentencing; and in-state criminal history, a count variable defined as the total number of prior felony convictions in approximately the 10 years prior, as recorded by MT DOC.
Regression Analysis: Summary Statistics
Means and proportions for the dependent variables are shown in Table A7 below; means and proportions for the independent and control variables are summarized in Table A8 below.

Regression Analysis: Results
Regression analysis was used to examine the extent to which there are racial disparities in incarceration length of stay, accounting for contextual and defendant characteristics. Negative binomial regression was used to analyze prison length of stay because it is an over-dispersed count variable. Results from regression analysis are presented in Table A9 below.
Revocations of Probation and Conditional Release
Analytic Sample 4: Probation and Conditional Release
The analytic sample for American Indian and White people on probation and conditional release was constructed from the correctional status data, yielding a total of 14,774 cases. To construct the sample, CSG Justice Center staff started with all people whose correctional status of probation or conditional release started between January 1, 2016, and June 30, 2020. If an individual had more than one probation or conditional release start during that period, a single start was selected at random. People who were supervised out of state were excluded. After more data processing, an additional 2,418 cases were excluded because they were missing values for key variables used in regression analysis; the data most frequently missing were risk assessment data. This yields an analytic sample of 12,356 cases.
Regression Analysis
Regression analysis was employed to investigate the extent to which racial disparities were present in the likelihood of supervision revocation after accounting for contextual as well as individual characteristics.
Regression Analysis: Measures
CSG Justice Center staff constructed a dependent (outcome) variable, as well as independent and control variables, using analytic sample 4.
Dependent Variable
The dependent variable for this analysis is supervision revocation, a binary measure indicating whether supervision was revoked during the first year of the probation or conditional release term. Note that analysis of supervision revocations over two- and three-year periods, respectively, did not yield substantively different results.
Independent and Control Variables
The main independent variable is the race of the person convicted of a felony crime; like the other analyses documented in this report, this is a binary variable indicating whether the person is identified as American Indian or White in MT DOC records. Additionally, there were two sets of control variables constructed to account for both key contextual and individual characteristics, respectively.
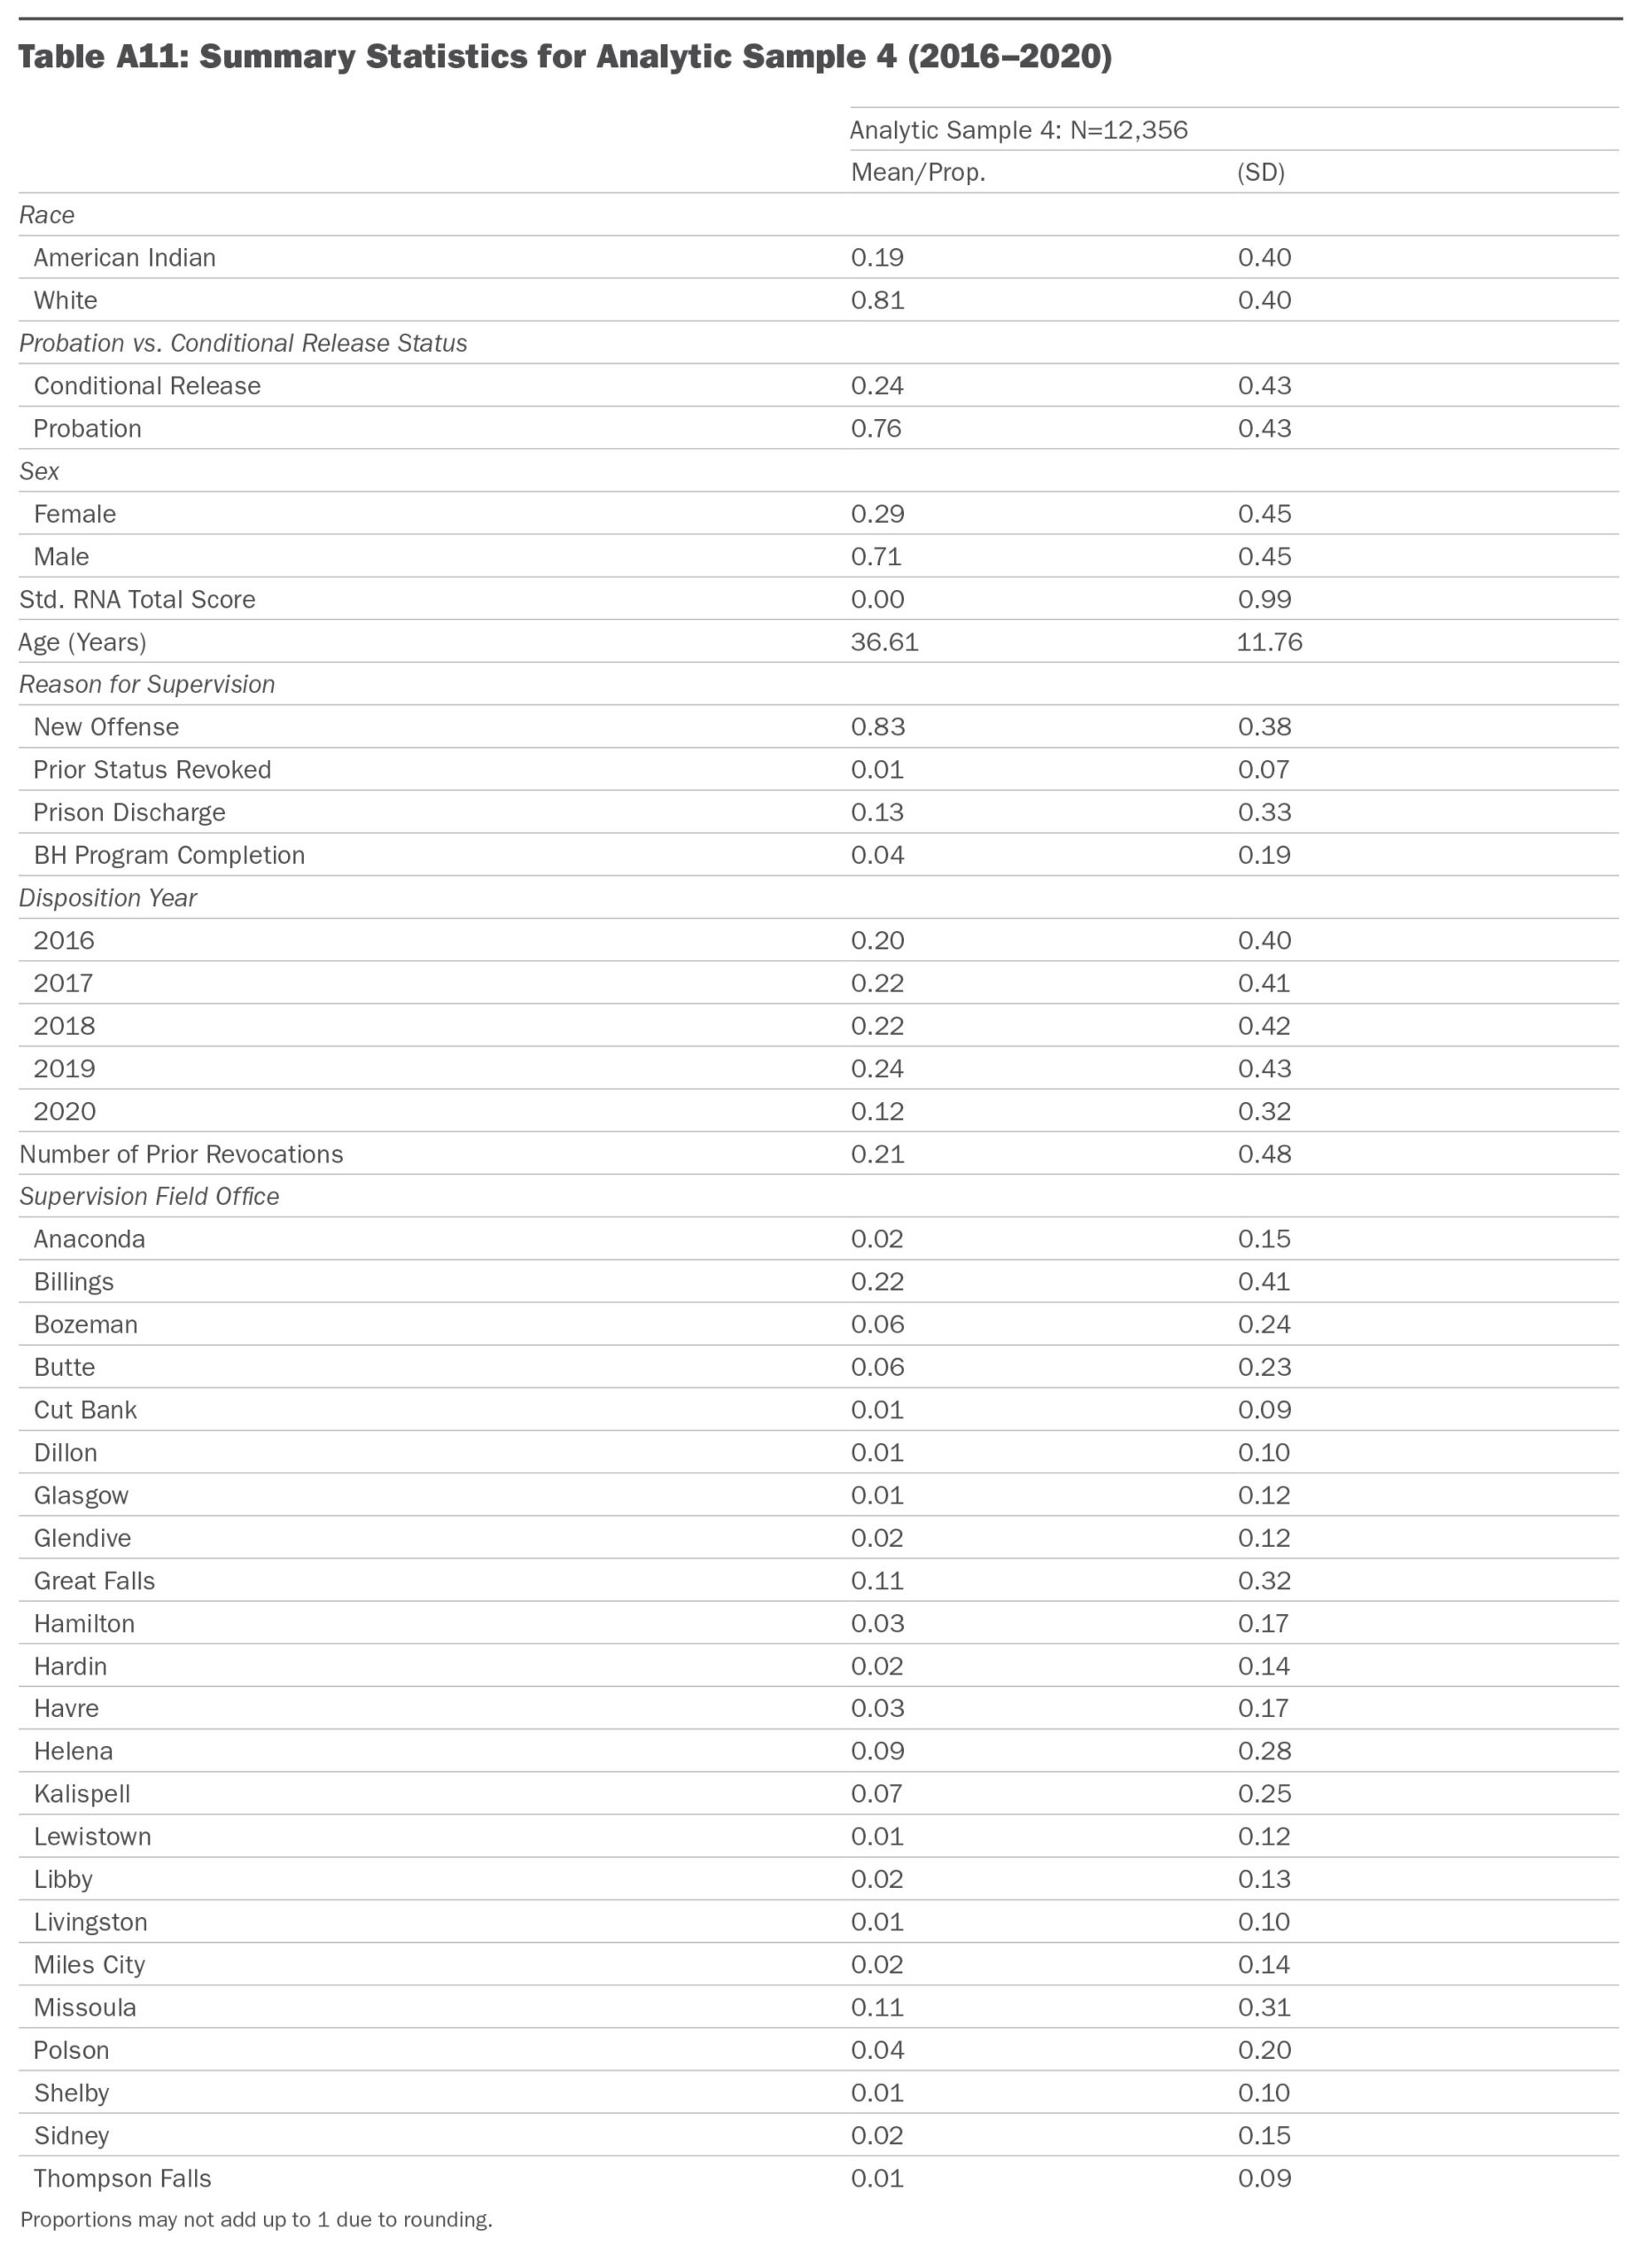
In terms of contextual characteristics, the first control variable is probation versus conditional release status, a binary variable. Additionally, control variables were constructed for the reason for probation/conditional release supervision, a series of dummy variables indicating the reason for supervision, including a new offense; a revocation of prior status; prison discharge (i.e., as part of a split sentence that included prison time followed by probation); or behavioral health program completion. Finally, a control was developed for disposition year of the case resulting in probation/conditional release, as well as a control for supervision agency, a series of dummy variables indicating which of the 23 states probation and parole field offices were involved with each supervision case.
In terms of individual characteristics, in addition to race, demographic information included a binary variable for sex (female or male) and a count variable for age at the time of case sentencing. A control for prior revocations was included, coded as count variable for the total number of prior supervision revocations. Finally, a control for overall risk and need score was included, using RNA information (the Montana Offender Reentry and Risk Assessment, or MORRA, for men, and the Women’s Risk and Needs Assessment, or WRNA, for women). Note that scores for the MORRA versus WRNA have different ranges and distributions; to account for this, CSG Justice Center staff standardized the scores and additionally included an interaction between sex and the standardized overall score. This interaction term allows the effect of RNA variables to vary by sex.
Regression Analysis: Summary Statistics
Means and proportions for the dependent variables are shown in Table A10 below; means and proportions for the independent and control variables are summarized in Table A11.

Regression Analysis: Results
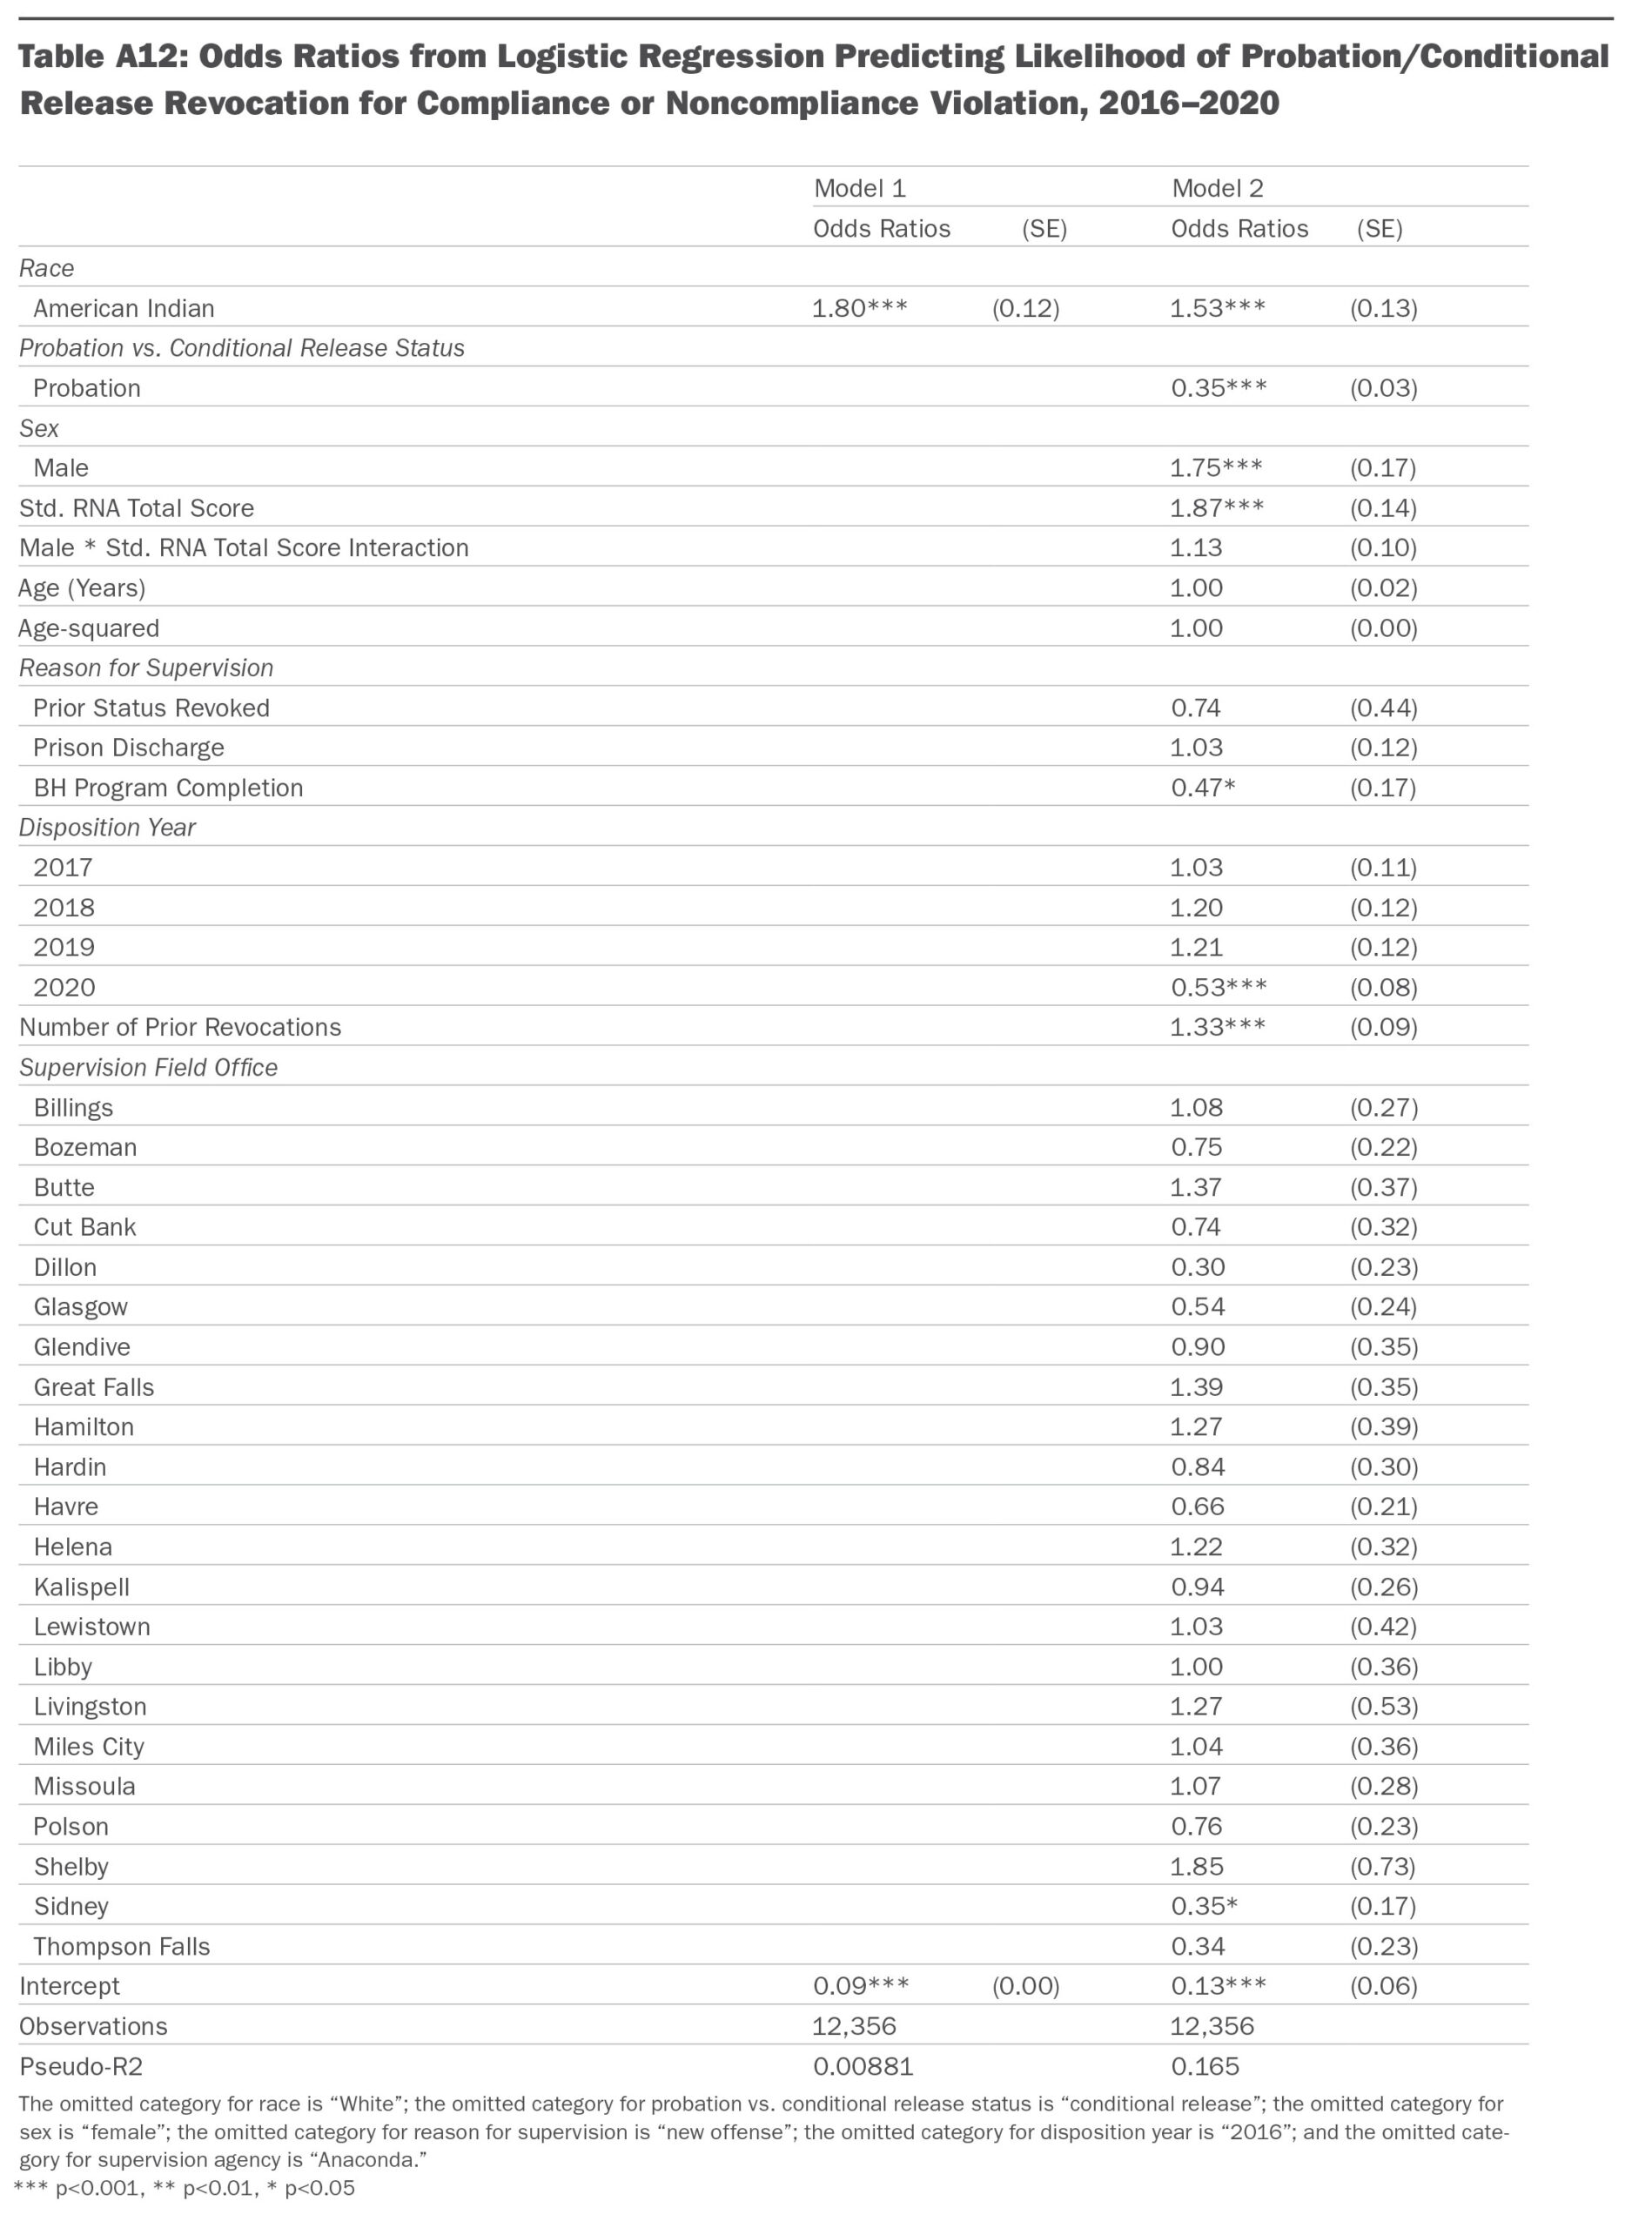
Regression analysis was used to examine the extent to which there are racial disparities in the likelihood of facing a probation or conditional release revocation during the first year of supervision after accounting for contextual and defendant characteristics. Logistic regression was used since the outcome is binary.
CSG Justice Center staff used a series of logistic regression models to examine this outcome. First, a model predicting the likelihood of any supervision revocation during the first year was run, and after accounting for key contextual and individual characteristics, evidence of an American Indian-White disparity was identified. These results are presented in Table A12 below.
CSG Justice Center staff then ran separate models comparing two subgroups that are of particular interest to Montana stakeholders. Specifically, in May 2017, Montana enacted legislation that defined two types of supervision violations: compliance (relatively less serious violations related to violating conditions of supervision) and noncompliance violations (more serious violations including new offenses and four other categories of behavior—for details, see the Glossary).56
Although MT DOC did not track compliance and noncompliance violations in their data system until 2021, CSG Justice Center staff were able to develop a proxy for these differences after consulting MT DOC staff.57 Cases in which a revocation resulted in an incarceration term greater than 9 months were coded as noncompliance violations (more serious), and cases in which a revocation resulted in an incarceration term of nine months or less were coded as compliance violations (relatively less serious).
Using this information, CSG Justice Center staff analyzed whether there are disparities for these two types of violations for probation or conditional release terms that started on May 17, 2017, through 2020. Results indicate that there are racial disparities for both types of violations.
Sensitivity Tests
Finally, CSG Justice Center staff ran several sensitivity tests. A bivariate logistic regression examining the relationship between race and likelihood of a revocation was run on the full MT DOC sample (i.e., before dropping cases due to missing data, such as risk assessment information); a statistically significant American Indian-White disparity was observed in this group. Additionally, regression models were run examining the likelihood of revocation over two- and three-year periods; results were very similar to those in the main analysis. The results of these tests indicate that the evidence of racial disparity in revocations (as presented in Table A12 below) is a robust finding, i.e., it is not sensitive to decisions to analyze specific subgroups of the supervision population.
Revocations of Parole
Analytic Sample 5: Parole
Like the analytic sample for people on probation and conditional release, the analytic sample for American Indian and White people on parole is constructed from the correctional status data; a total of 2,908 cases were identified. To construct the sample, CSG Justice Center staff started with all people whose correctional status of parole started between January 1, 2016, and June 30, 2020. If an individual had more than one parole start during this period, a single start was selected at random. People who were supervised out of state were excluded. After more data processing, an additional 747 cases were excluded because they were missing values for key variables used in regression analysis; the data most frequently missing were risk assessment data. Finally, an additional 46 cases were excluded from four supervision agencies because there was no variation in revocation outcomes for supervision field offices (including Dillon, Glasgow, Lewistown, and Libby), such that it was not possible to include them in the model. The final analytic sample consists of 2,115 cases.
Regression Analysis
Regression analysis was employed to investigate the extent to which racial disparities were present in the likelihood of parole revocation after accounting for contextual and individual characteristics.
Regression Analysis: Measures
CSG Justice Center staff constructed a dependent (outcome) variable, as well as independent and control variables, using analytic sample 5.
Dependent Variable
The dependent variable for this analysis is parole revocation, a binary measure indicating whether parole was revoked during the first year of a parole term. Note that analysis of parole revocations over two- and three-year periods, respectively, did not yield substantively different results.
Independent and Control Variables
The main independent variable is the race of the person convicted of a felony crime; like the analyses reported above, this is a binary variable indicating whether the person is identified as American Indian or White in MT DOC records. Additionally, there were two sets of control variables constructed to account for both key contextual and individual characteristics, respectively.
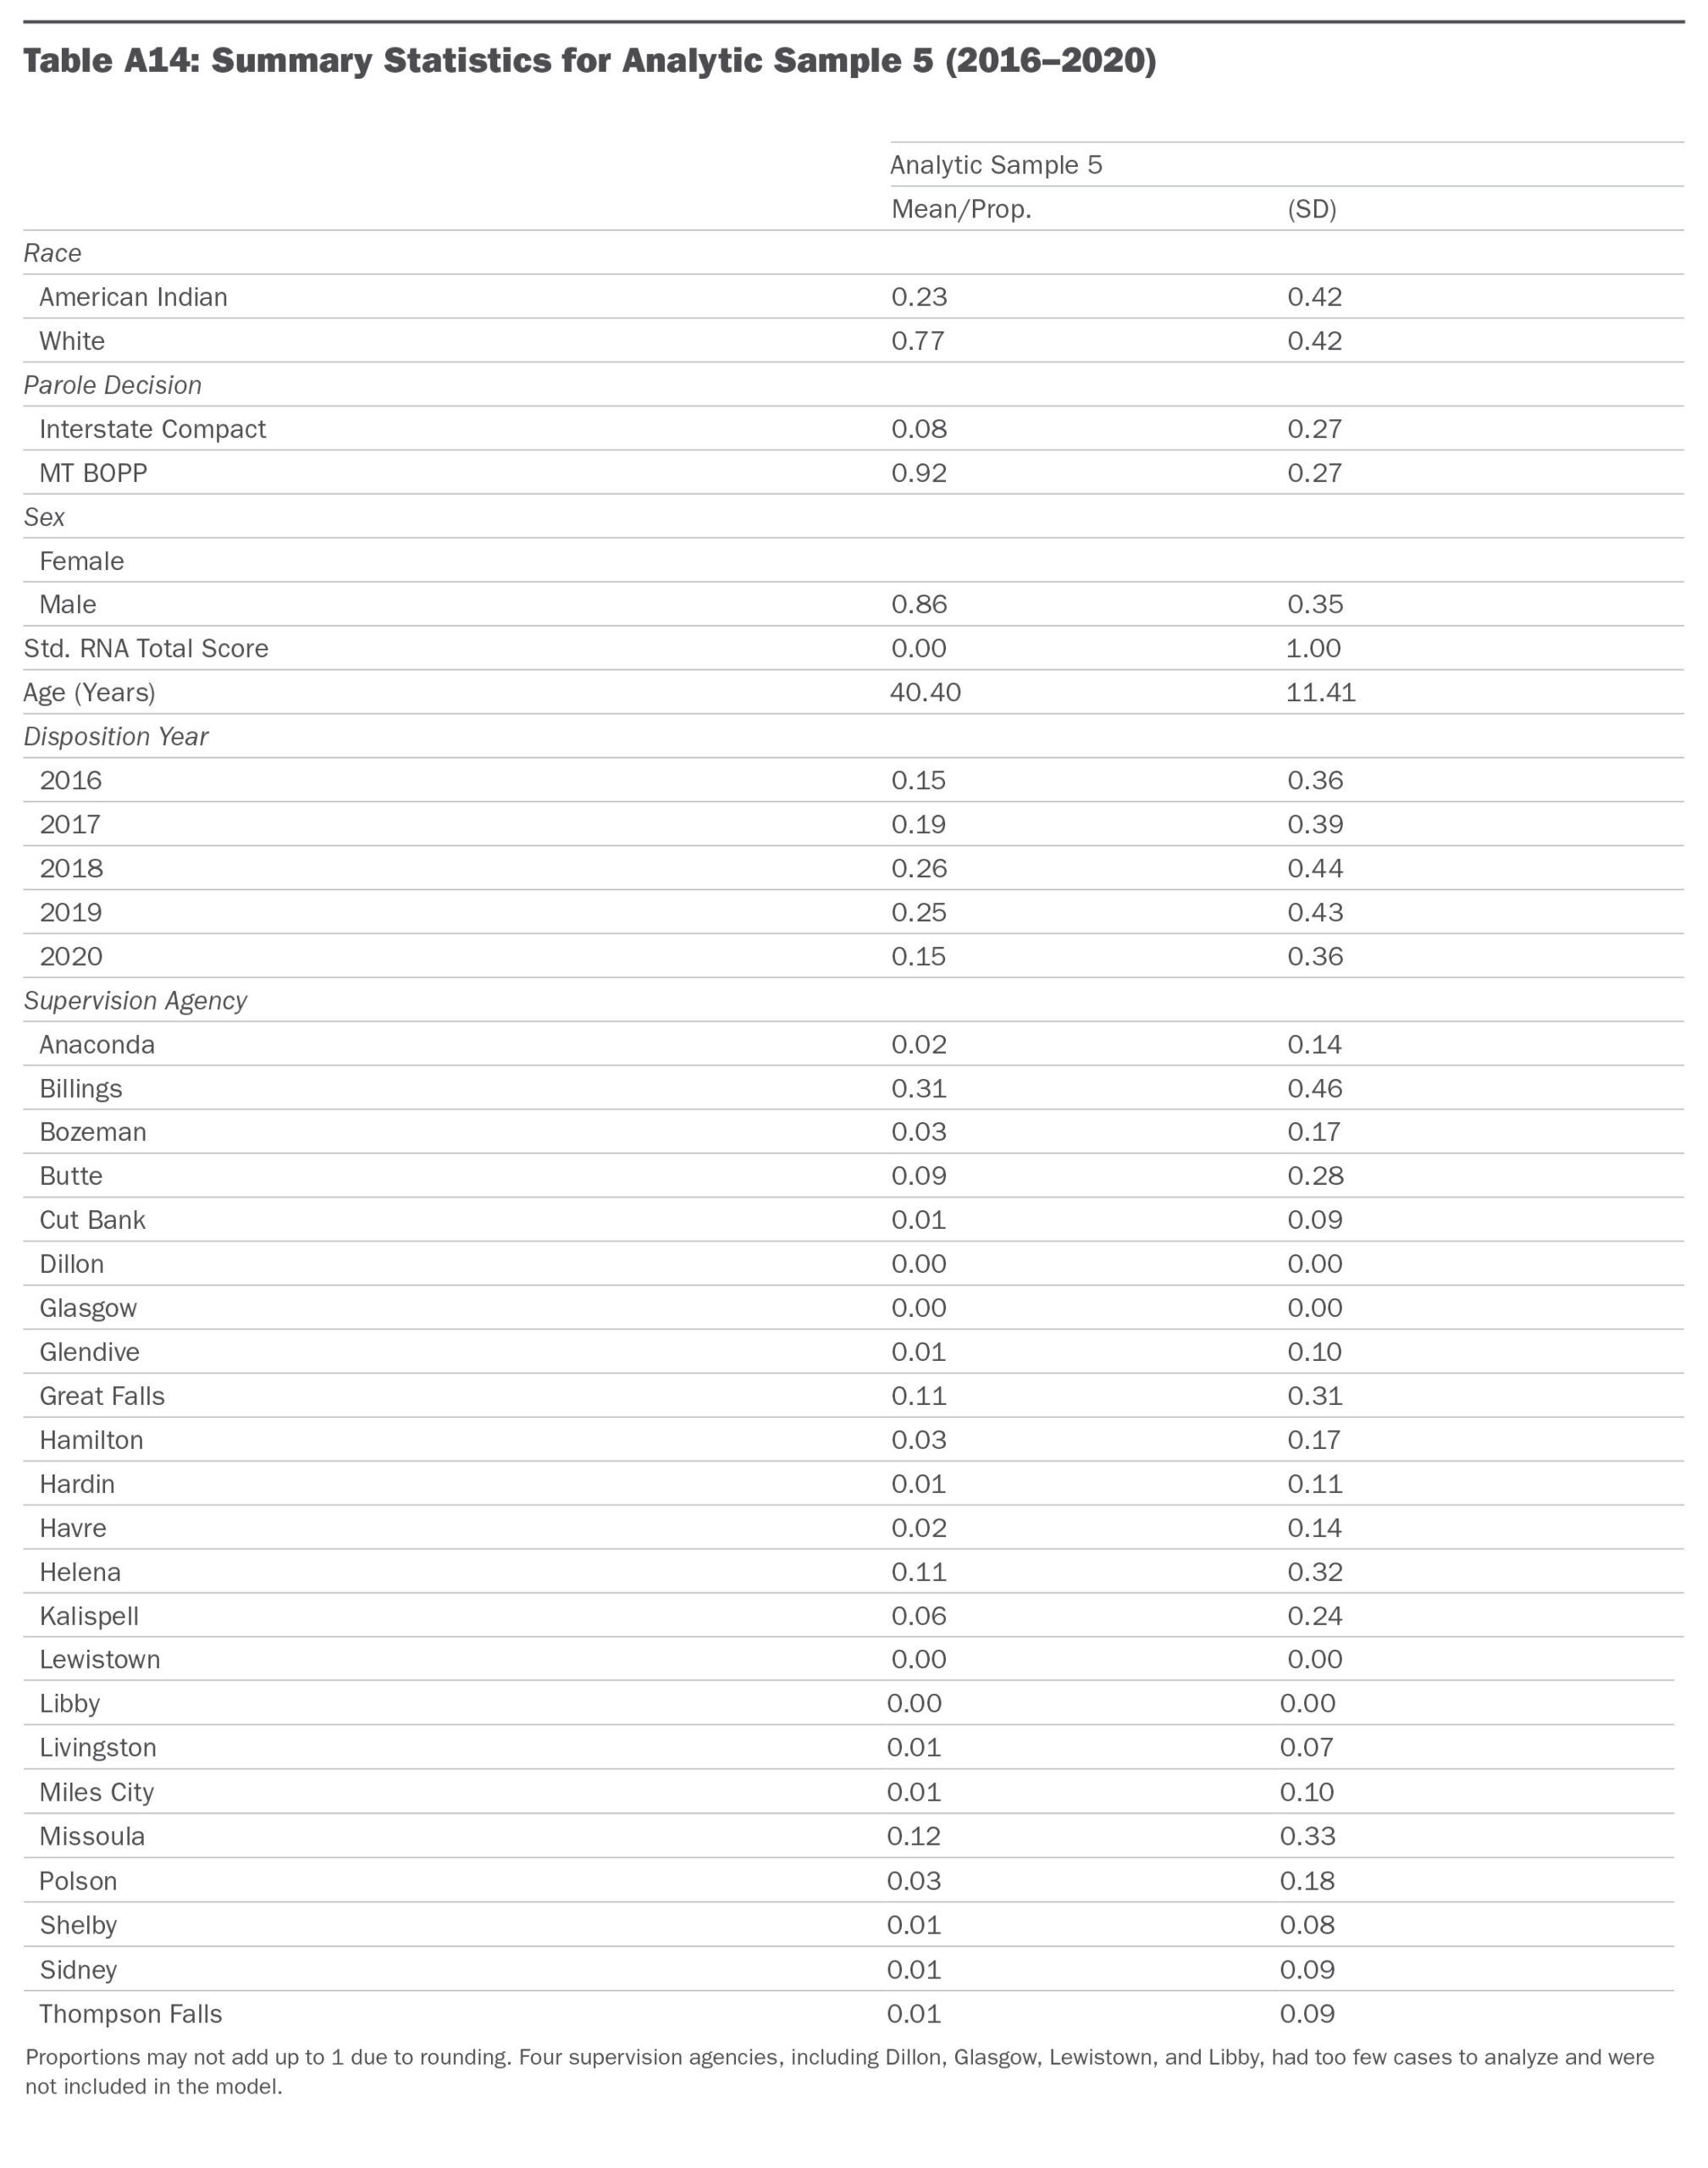
In terms of contextual characteristics, the first control variable is a binary variable indicating whether the decision regarding parole eligibility was made by MT BOPP or came about by interstate compact (meaning there was an out-of-state conviction and Montana arranged with the other state to have the person serve parole in Montana). Additionally, a control was developed for disposition year of the case resulting in parole. A control was also developed for supervision agency—a series of dummy variables indicating which state parole field office was involved in the case (as noted above, 4 of the 23 supervision agencies, including Dillon, Glasgow, Lewistown, and Libby, had too few cases to analyze and were not included in the model, so a total of 19 agencies were part of the analysis).
In terms of individual characteristics, in addition to race, demographic information included a binary variable for sex (female or male) and a count variable for age at the time of case sentencing. Finally, a control for overall risk and need score was included, using RNA information (the Montana Offender Reentry and Risk Assessment, or MORRA, for men, and the Women’s Risk and Needs Assessment, or WRNA, for women). Note that scores for the MORRA versus WRNA have different ranges and distributions; to account for this, CSG Justice Center staff standardized the scores and additionally included an interaction between sex and the standardized overall score. This interaction term allows the effect of RNA variables to vary by sex.
Regression Analysis: Summary Statistics
Means and proportions for the dependent variables are shown in Table A13 below; means and proportions for the independent and control variables are summarized in Table A14.

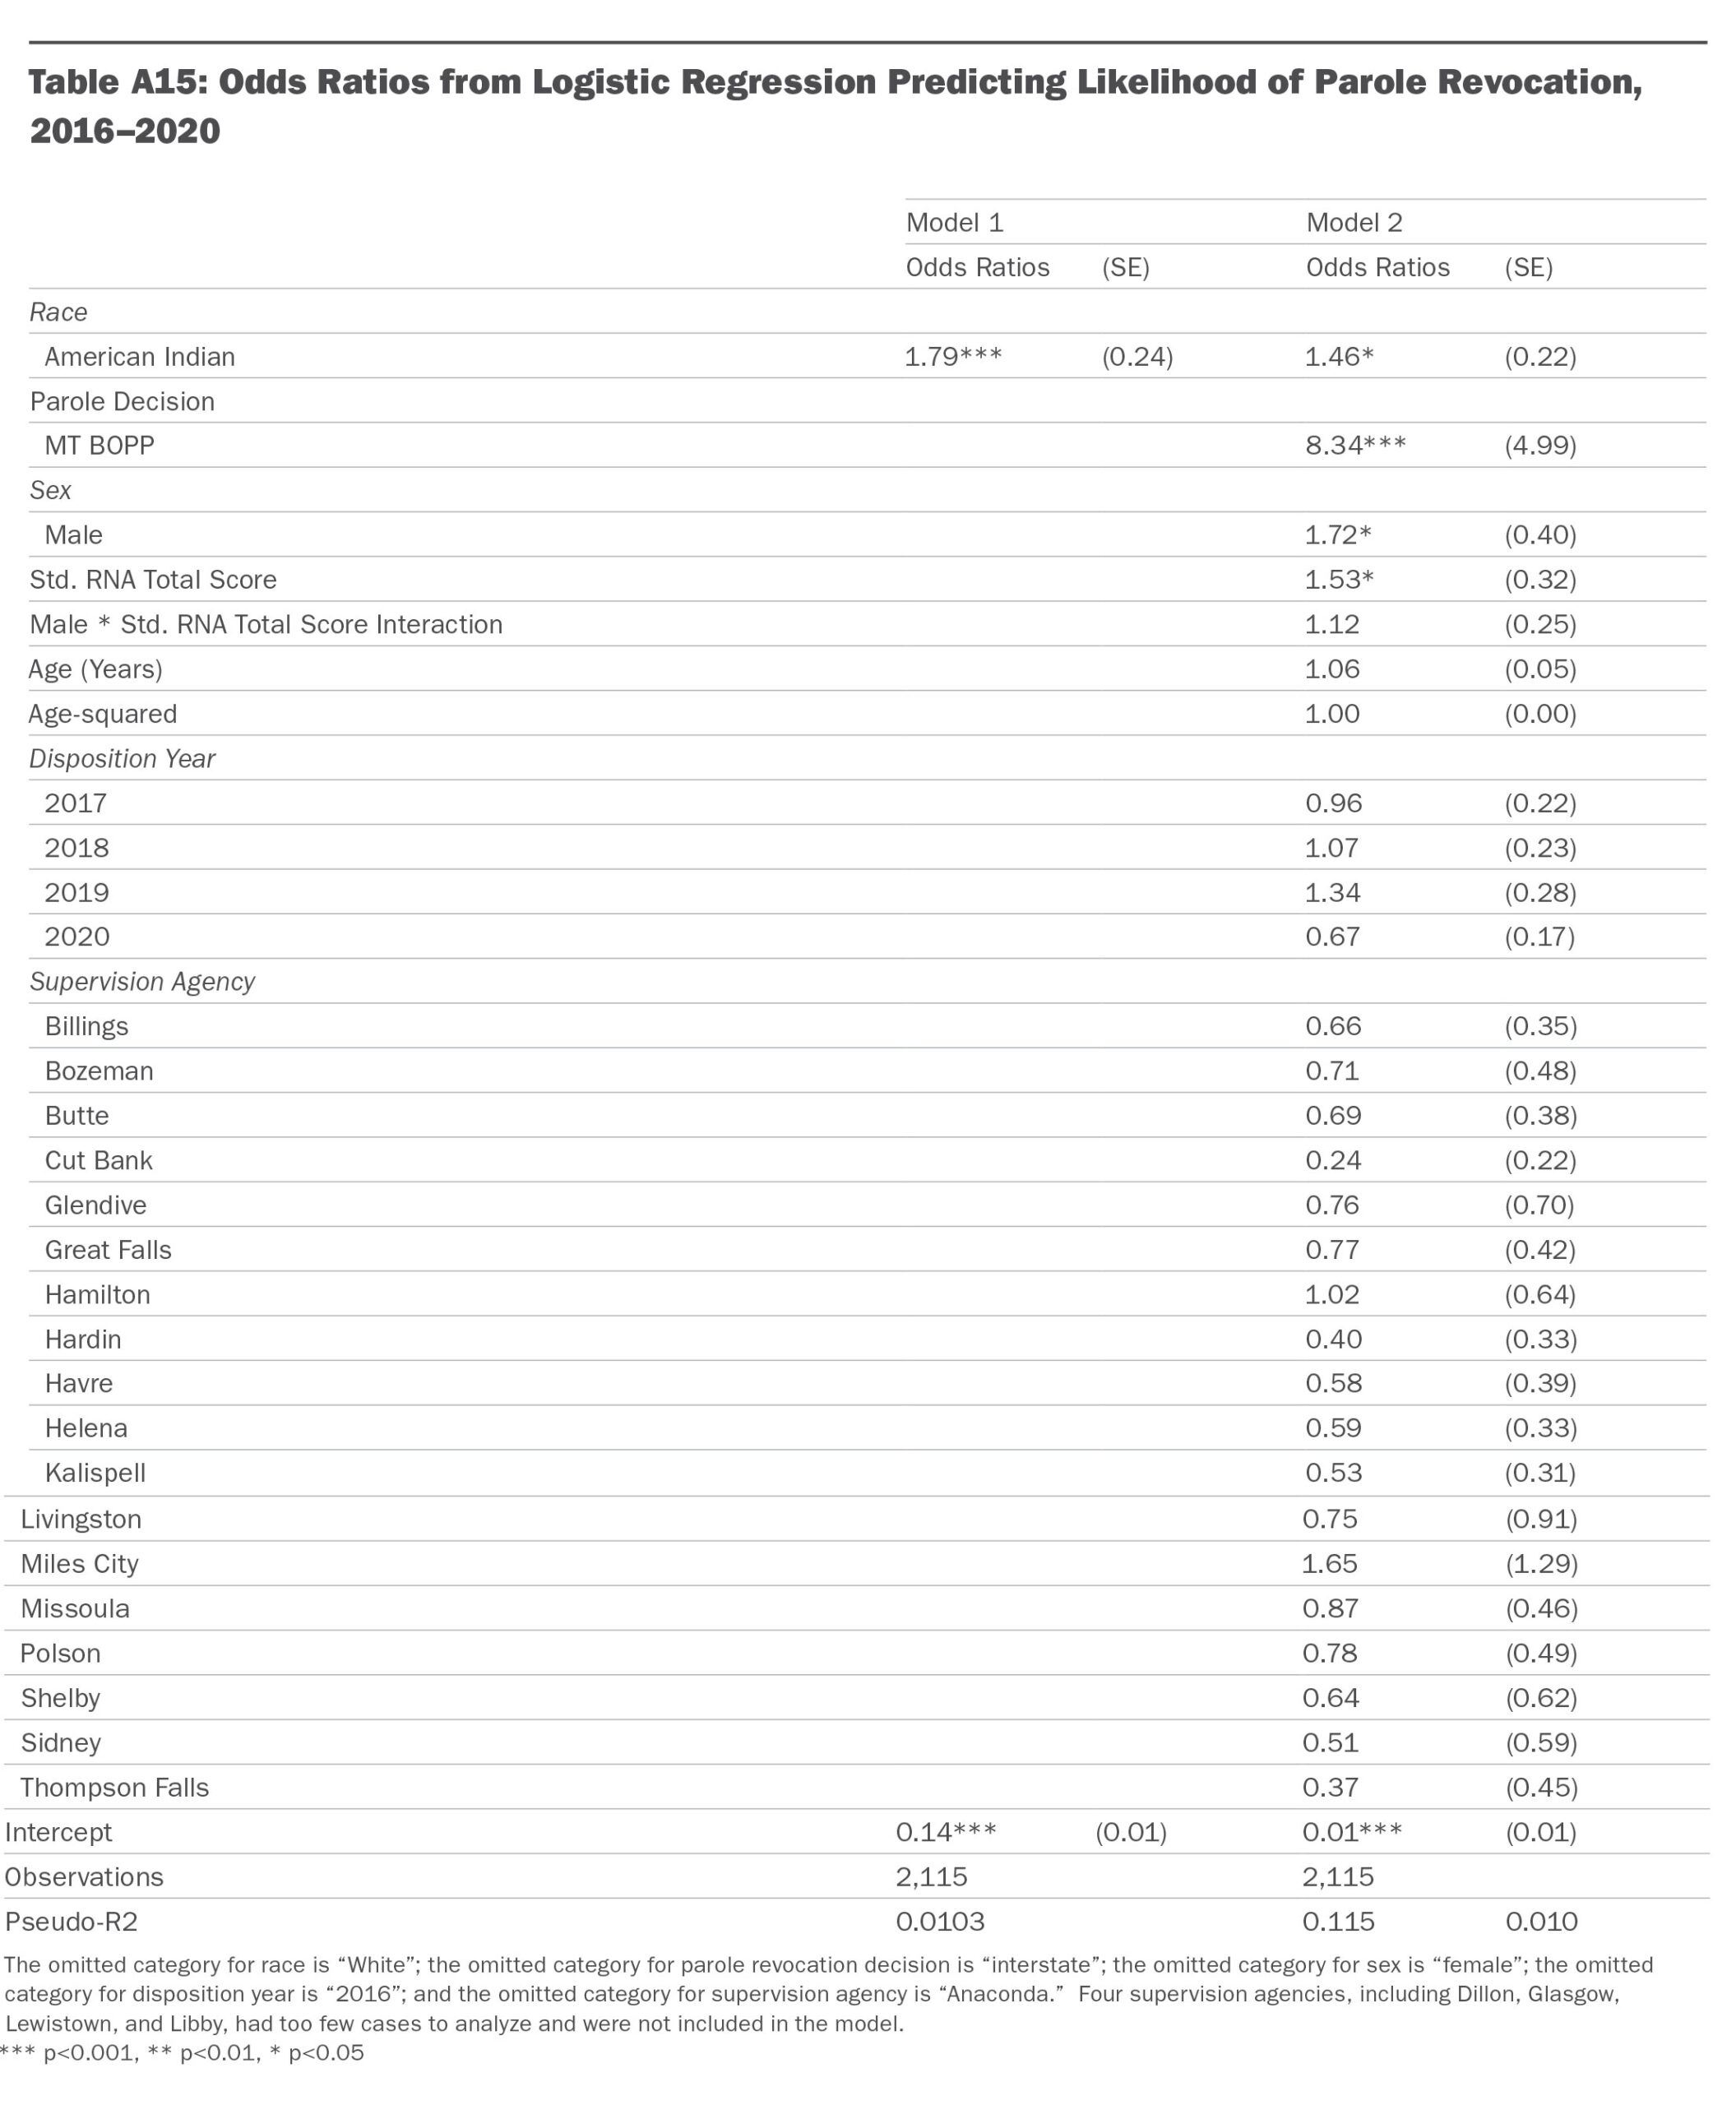
Regression Analysis: Results
Regression analysis was used to examine the extent to which there are racial disparities in the likelihood of facing a parole revocation during the first year of supervision after accounting for contextual and defendant characteristics. Logistic regression was used since the outcome is binary. Results from regression analysis are presented in Table A15 below.
Notes
53. Email communication between The Council of State Governments Justice Center and Montana Department of Corrections Records Department, October 26, 2021.
54. Montana Supreme Court, Montana Supreme Court Bond Schedule (Helena, MT: Montana Supreme Court, 2022).
55. Ibid.
56. See 46-23-1001, MCA, as amended by Sec. 11, Ch. 392, L. 2017.
57. Meeting between The Council of State Governments and Montana Departments of Corrections Probation and Parole Division, January 13, 2022.