Technical Appendix
Table of Contents
Quantitative Data Sources
CSG Justice Center staff obtained data from two main sources for this project: the Vermont Judiciary, which provided court records for criminal cases, and the Vermont Crime Information Center, which houses the state’s criminal history repository. Additionally, Census data were used in RRI calculations.
Vermont Judiciary: The main courts dataset analyzed for this project was obtained via a data use agreement between the CSG Justice Center and the Vermont Judiciary. Court staff shared data on 160,079 criminal felony and misdemeanor court charges disposed between January 1, 2014, and December 31, 2019. By grouping together charges filed on the same day with the same case number, CSG Justice Center staff identified a total of 90,142 cases that were used to construct an analytic sample (see section below on Primary and Secondary Analytic Samples for details).
Vermont Department of Public Safety Crime Information Center (VCIC): In addition to court data, CSG Justice Center staff obtained in-state criminal history information via a data use agreement with the VCIC. CSG Justice Center staff securely submitted information on defendants in the racial equity analysis to VCIC and obtained a matching in-state criminal record for 93.4 percent of cases involving a defendant who resided in Vermont at the time of case filing (some cases with matching criminal history data were not ultimately used in the analysis due to other exclusion criteria detailed in tables A1–2 below). Although matching criminal record information could include arrests, criminal cases, and convictions, only conviction information was used to develop a criminal history score. Criminal history data were used in the secondary analysis only, as they are relevant only for in-state residents and were unlikely to be complete for out-of-state residents.
U.S. Census Data: CSG Justice Center staff also obtained publicly available Census data.64 Specifically, information on the number of Black and White Vermont residents, ages 17–85 years, was obtained for relative rate index calculations. This information was not, however, needed for regression analyses.
Primary and Secondary Analytic Samples
Primary Analytic Sample: Table A1 below provides details on how the primary analytic sample was constructed, starting from the initial 90,142 cases that were identified in the data shared by the Vermont Judiciary. The final primary analytic sample includes 79,514 cases.
Table A1. Development of Primary Analytic Sample: Vermont and Out-of-State Residents

Subsamples: The final primary analytic sample used to analyze the first outcome, conviction, included 79,514 cases. As summarized in Table A2, this group was then narrowed to the subset of 49,594 cases where there was a conviction to analyze the second outcome, incarceration. A final subsample was developed, consisting of the 10,754 cases with a sentence to incarceration and no missing information for minimum sentence length, to analyze the third regression outcome, incarceration sentence length.
Table A2. Primary Analytic Sample and Subsamples

Secondary Analytic Sample: Table A3 provides details on how the secondary analytic sample was constructed, starting from the 79,514 cases used in the primary analyses.
Table A3. Development of Secondary Analytic Sample: Vermont Residents Only

Subsamples: The final secondary analytic sample used to analyze the first outcome, conviction, included 68,471 cases. As indicated in Table A4, this group was then narrowed to the subset of 43,601 cases where there was a conviction to analyze the second outcome, incarceration. Lastly, a final subsample was developed, consisting of the 10,062 cases with a sentence to incarceration and no missing information for minimum sentence length, to analyze the third regression outcome, incarceration sentence length.
Table A4. Secondary Analytic Sample and Subsamples

Relative Rate Indices
Starting with the primary analytic sample consisting of 79,514 cases disposed between 2014 and 2019, Black-White relative rate indices (RRIs) were calculated for misdemeanor and felony cases, respectively, per year. Figure A1 below presents an example of an RRI calculation for misdemeanor cases that were disposed in Vermont in 2019.
Figure A1. Black-White Relative Rate Index Calculation for Misdemeanor Cases (2019)65

Calculating Relative Rate Indices
As shown in Figure A1, to calculate an RRI for 2019 misdemeanor cases, the number of misdemeanor cases in which a Black person was a defendant is divided by the number of Black people, ages 17–85 years, who were living in Vermont that year; this provides a misdemeanor case rate of .0689. Stated differently, about 68.9 per 1,000 Black people were defendants in a misdemeanor case in 2019.
When the same calculation is performed for White people, the misdemeanor case rate is .0197, meaning that 19.7 per 1,000 White people were defendants in a misdemeanor case in 2019. Finally, the Black rate is divided by the White rate to obtain an RRI of 3.5. An RRI over one indicates that Black people are disproportionately represented in criminal cases relative to White people in Vermont. In 2019, Black people were 3.5 times more likely than White people to be defendants in a misdemeanor case.
Regression Analysis: Measures
To complete regression analyses, a series of relevant dependent (outcome) variables, as well as independent and control variables, were constructed using Vermont Judiciary case disposition data.
Dependent Variables
The first dependent variable is conviction, a binary variable indicating if there was a conviction—via plea agreement or jury trial—for any charge filed in the case. The alternative values here included case dismissal or acquittal. The second dependent variable is incarceration, a binary variable indicating whether a sentence to “straight” incarceration was imposed in the case. Alternatives to straight incarceration include probation, a split sentence (which is very uncommon in Vermont), a deferred sentence, suspended sentence, or a sentence to pre-approved furlough, which may include a work or treatment program—rather than imprisonment—administered by the Department of Corrections.
The third and final dependent variable is incarceration sentence length, specifically, the minimum number of prison days imposed. To construct incarceration sentence length, sentencing information was summarized across the case. If there was only one conviction that included a prison sentence, then the incarceration sentence length outcome corresponds to that particular sentence only.
However, in many cases, there are several charges for which the defendant is convicted, and each conviction is associated with a prison term, to be served either concurrently or consecutively. In cases where the prison terms are to be served concurrently, the incarceration sentence length outcome corresponds to the longest sentence in the case (e.g., if someone is sentenced to serve 100 days and 200 days concurrently, the effective sentence length is 200 days). In cases where the prison terms are to be served consecutively, then the incarceration sentence length outcome was constructed by adding all terms together (e.g., if a person is sentenced to serve 100 days and 200 days consecutively, the effective sentence length is 300 days). Among the 12,576 cases in the data provided by the judiciary that had information for minimum sentence length available, 1,447 cases (about 11.5 percent) had more than one prison term listed (across multiple convictions), but notation about whether those terms were to be served concurrently versus consecutively was not recorded in a consistent manner. As a result, these cases were excluded from the incarceration sentence length analysis because a reliable estimate of minimum sentence length imposed could not be calculated. Decisions to construct the sentence length variable in the manner just described were based on conversations with Vermont Judiciary court administrative staff, who provided information on how sentencing information typically works in practice.66
Independent and Control Variables
The main independent variable is defendant race, a binary variable indicating whether the defendant identified as Black or White. The Vermont Judiciary obtains race information from law enforcement; law enforcement practice is to ask individuals to report their racial identity.67 In addition, two sets of control variables were constructed to account both for key case and defendant characteristics, respectively.
In terms of case characteristics, the first control variable is the offense level and category. Offense level (misdemeanor or felony) is recorded for every charge in a case; a case is considered a felony case if one or more felony charges are filed in the case. Additionally, a severity index specific to Vermont68 was used to rank offense categories from most to least severe. Using both offense level and category, each case was classified into one of 10 possible categories to reflect the most severe charge filed in the case (e.g., misdemeanor-public order, felony-person; for a full list, see Table 1 on p. 8). A category for misdemeanor weapons and felony weapons cases was initially constructed but later dropped from the analyses because there were too few cases to reliably compare Black and White defendants. Additionally, a count variable for the total charges filed in a case was constructed; this variable was logged to account for a skewed distribution, a standard statistical practice. Finally, controls for the year in which the case was disposed and an indicator for the county in which the case was processed were included.
Regarding defendant characteristics, in addition to race, demographic information included a binary variable for gender (female or male) and a count variable for age at the time of case filing. A variable indicating whether the defendant was a Vermont or out-of-state resident was constructed using court records on the defendant’s address at the time of case filing.
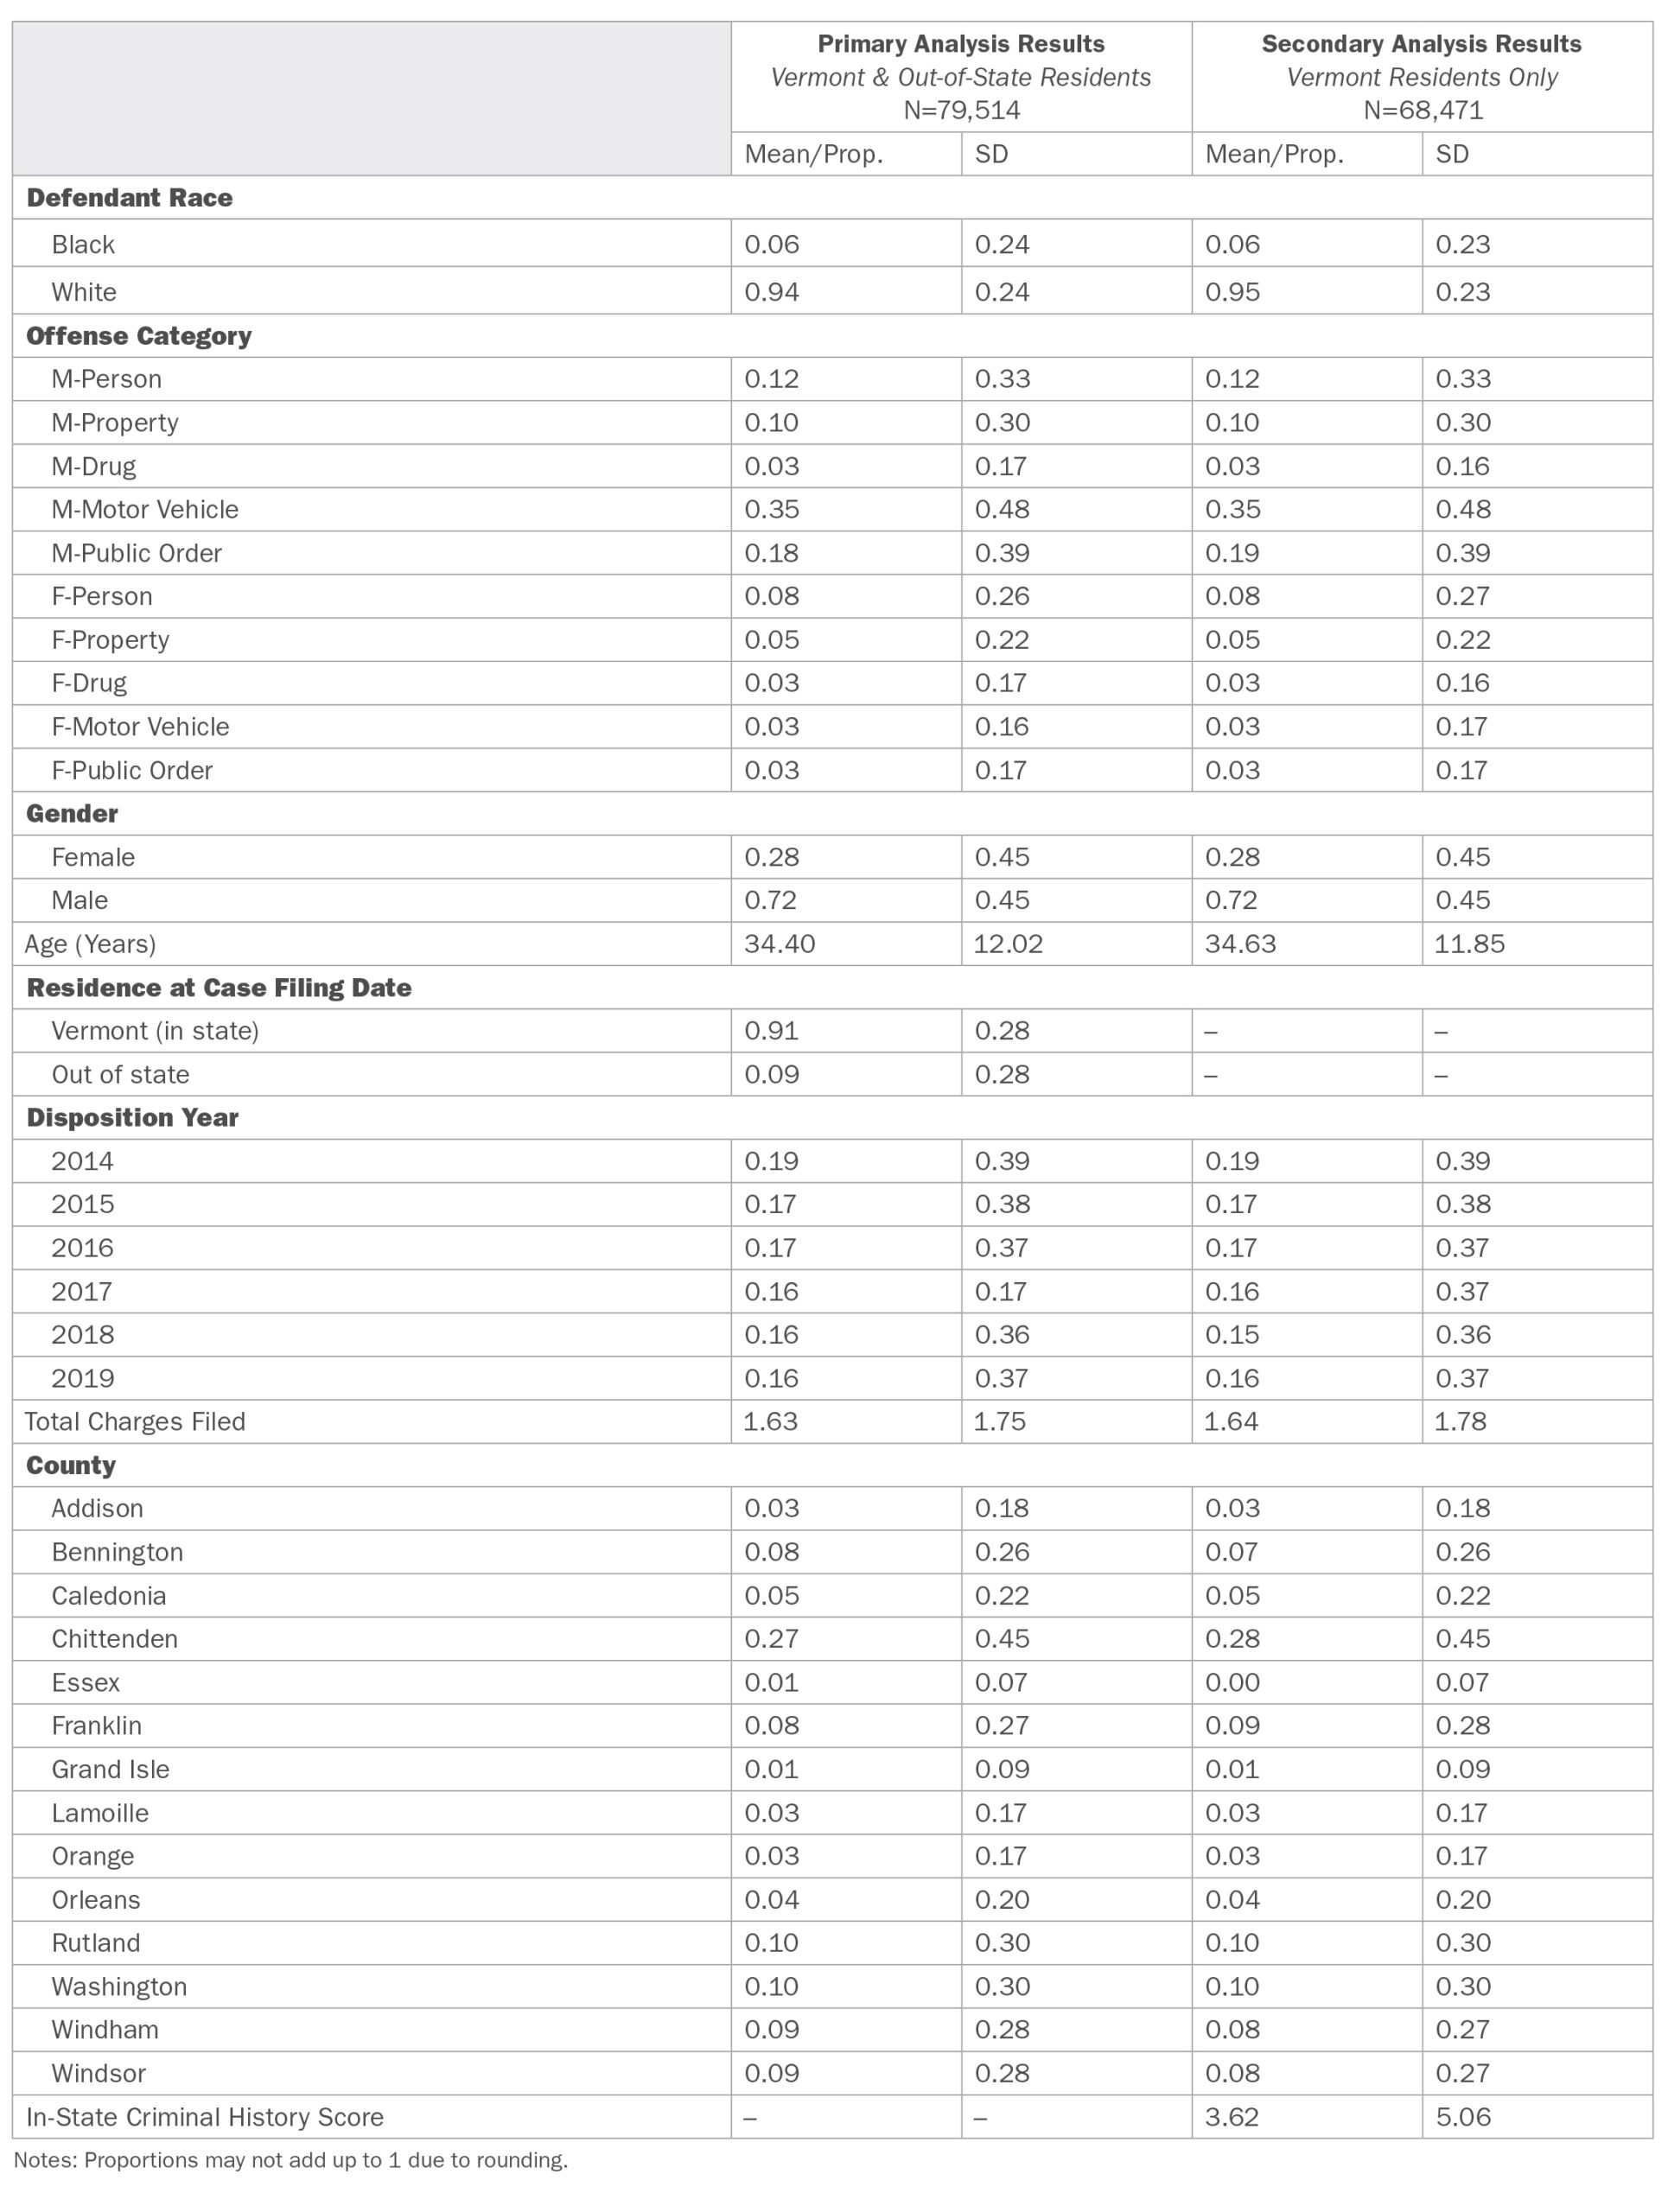
The primary analysis (detailed above) accounted for each of the case and defendant characteristics just described; the secondary analysis, which was restricted only to defendants who were Vermont residents, additionally accounted for in-state criminal history. To construct a criminal history score, conviction records from the Vermont Crime Information Center were used. Prior felony convictions were counted as a “1,” and prior misdemeanor convictions were counted as “.5”; the two added together yielded a total prior criminal history score.69 Because this criminal history variable included zero values and had a skewed distribution, it was adjusted using a log(x+1) transformation. Means and proportions for the dependent variables are shown in Table A5; means and proportions for the independent and controls variables are summarized in Table A6.
Summary Statistics: Primary and Secondary Analysis Groups
Table A5. Outcome Means/Proportions for Primary and Secondary Analytic Samples, by Race (2014–2019)

Table A6. Summary Statistics for Primary and Secondary Analytic Samples, 2014–2019
Regression Analysis Results
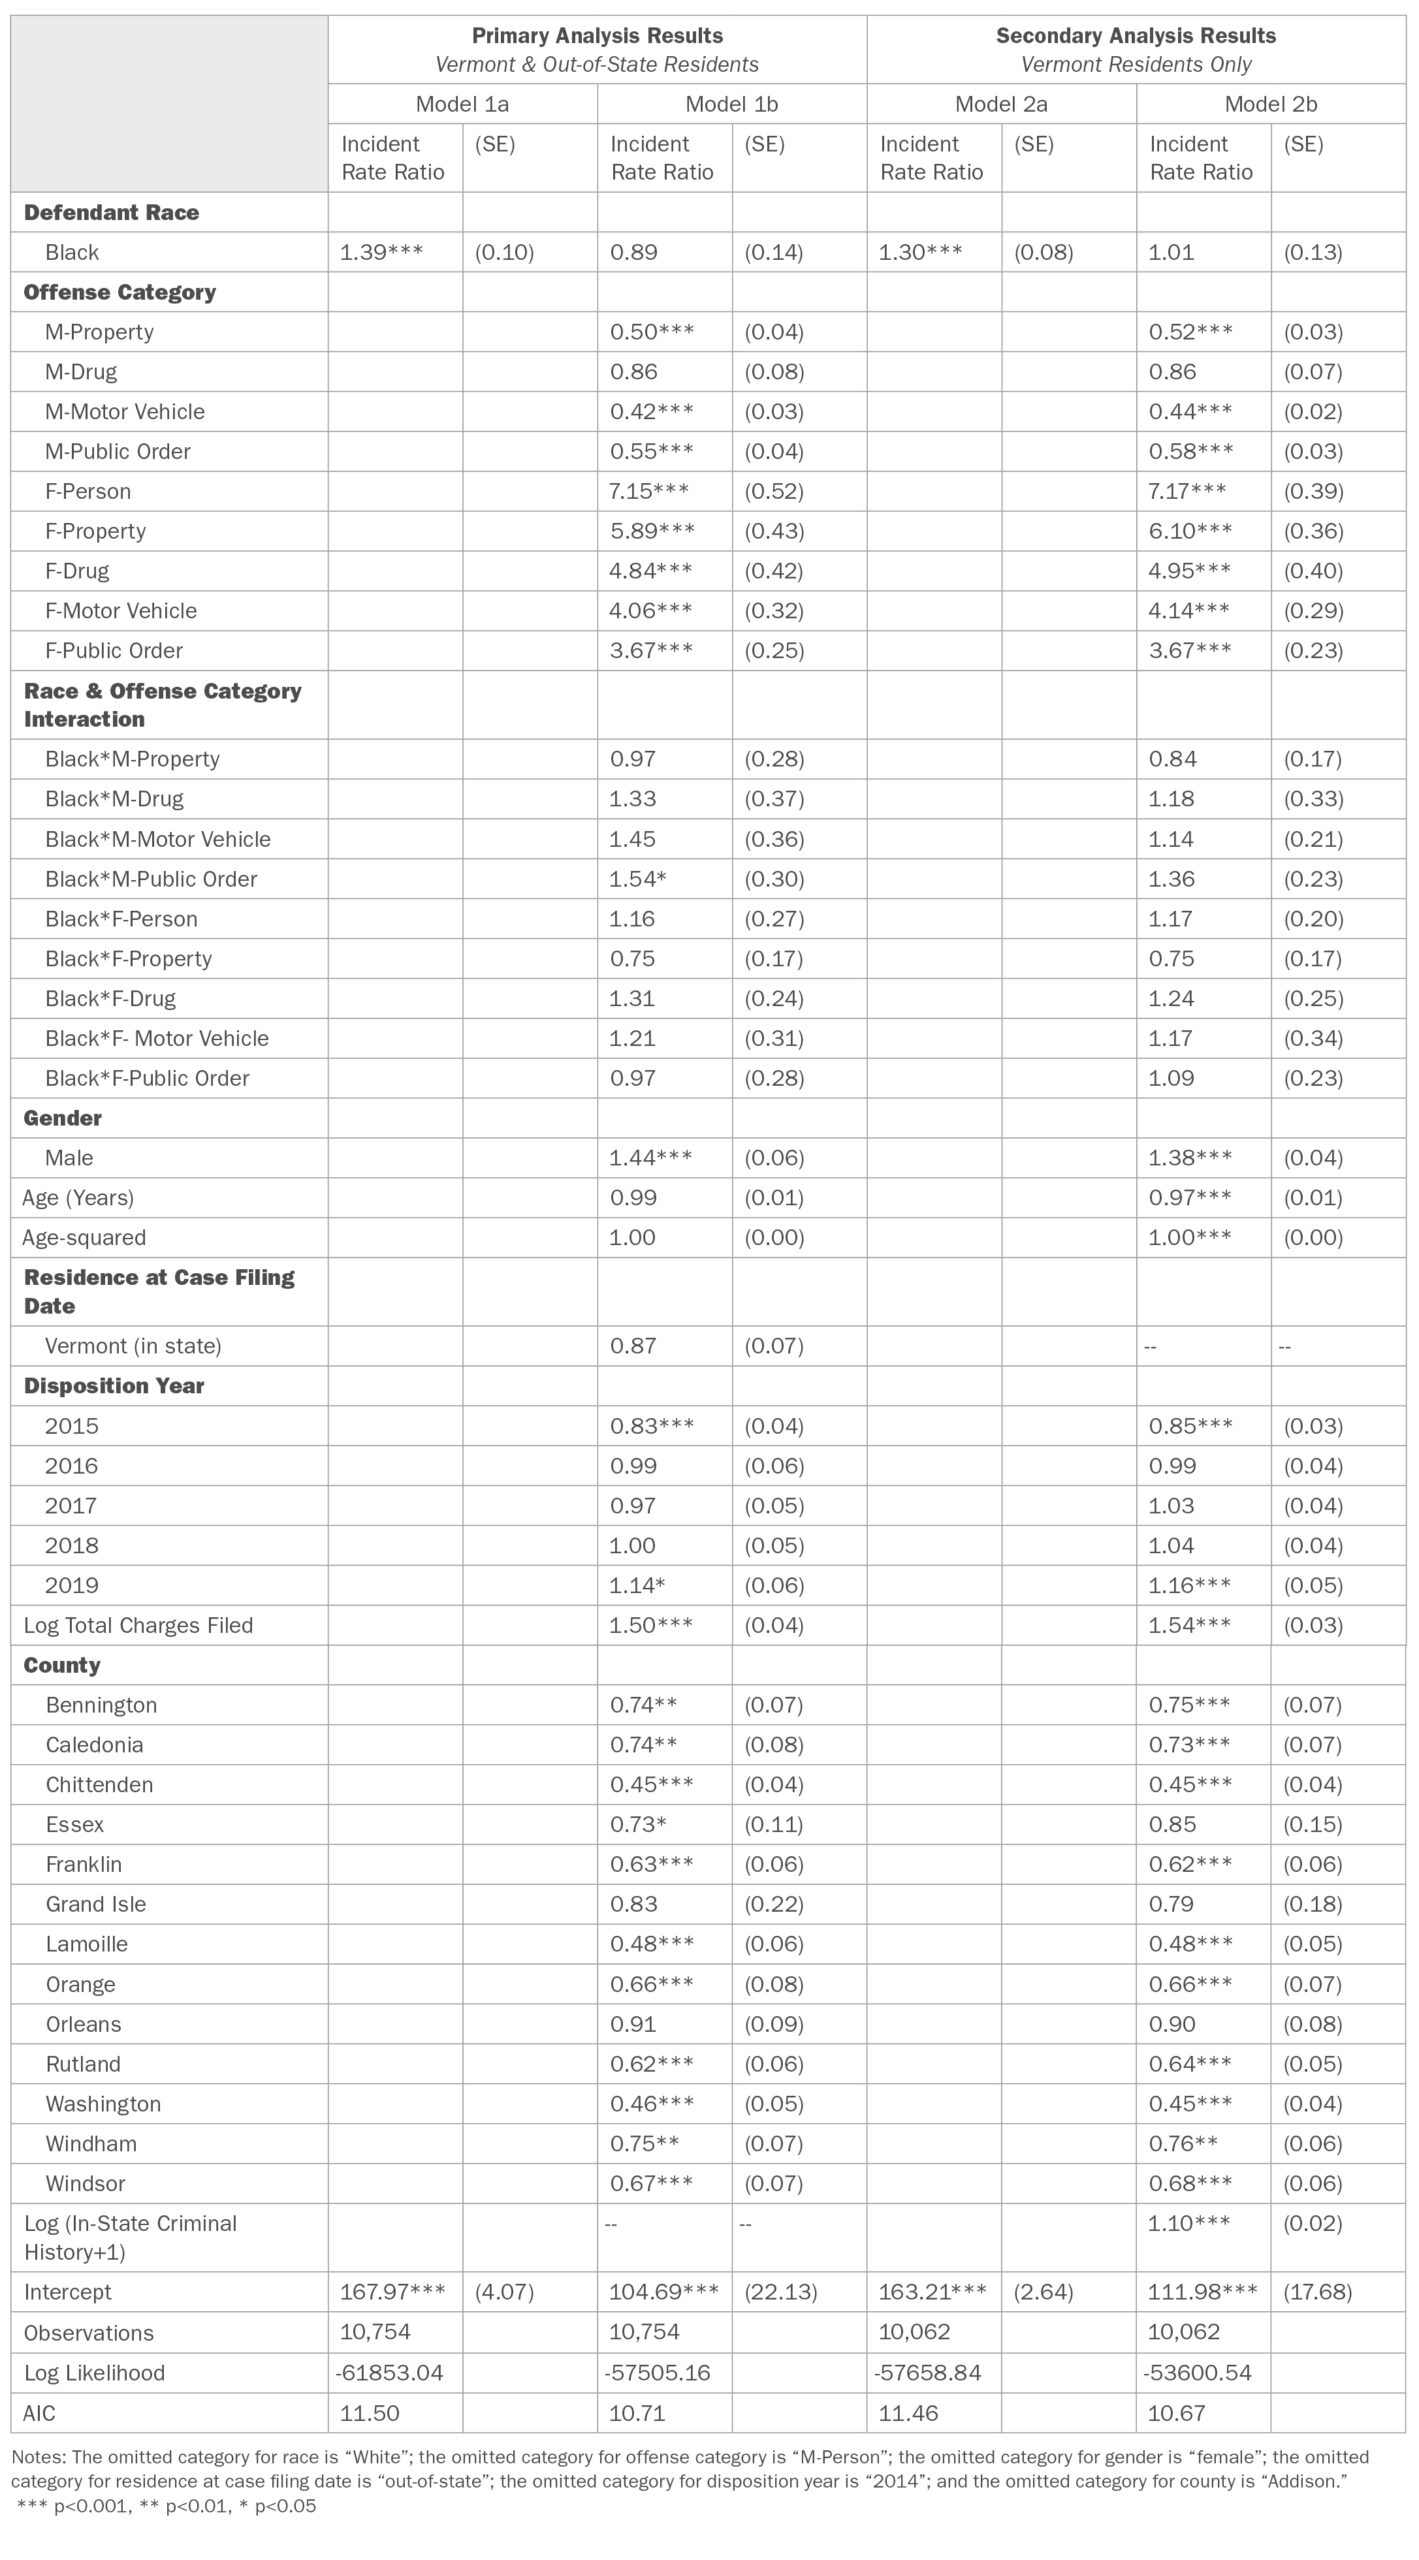
Regression analysis was used to examine the extent to which there are racial disparities at key decision-making points in Vermont’s court system after accounting for case and defendant characteristics. For each outcome—including (1) likelihood of conviction, (2) likelihood of a sentence to straight incarceration, and (3) incarceration sentence length—regressions were run first on the primary analysis sample and then on the secondary analysis sample; results from both sets of regression were compared to develop a conclusion. For binary outcomes—likelihood of conviction and likelihood of a sentence to straight incarceration—logistic regression was employed. For incarceration sentence length, a count variable, negative binomial regression was used because sentence length is an over-dispersed count variable, meaning that there is a high level of variation, or spread, in the distribution of this variable.
Table A7 presents a summary of results from all regression analyses. Table A7 explains that analysis results from both the primary and secondary analyses were used in combination to determine whether there was consistent evidence of a racial disparity for each decision-making point. Tables A8–10 present results from regression models for each outcome across the primary and secondary analytic samples. Recall that the size of the analytic sample varies across primary and secondary analyses, and between outcomes, due to data availability (as summarized in Tables A1–4 in the appendix).
To obtain the results that are depicted in Figures 7–9 (in the main body of the report), fully adjusted regression models were used to obtain predicted outcomes for each offense category (e.g., M-Person, F-Public Order), but results were only reported in graphical form when the Black-White difference in the predicted outcomes was statistically significant.
Table A7. Summary of Results from Primary and Secondary Analyses

Table A8. Odds Ratios from Logistic Regression Predicting Conviction, 2014–2019.
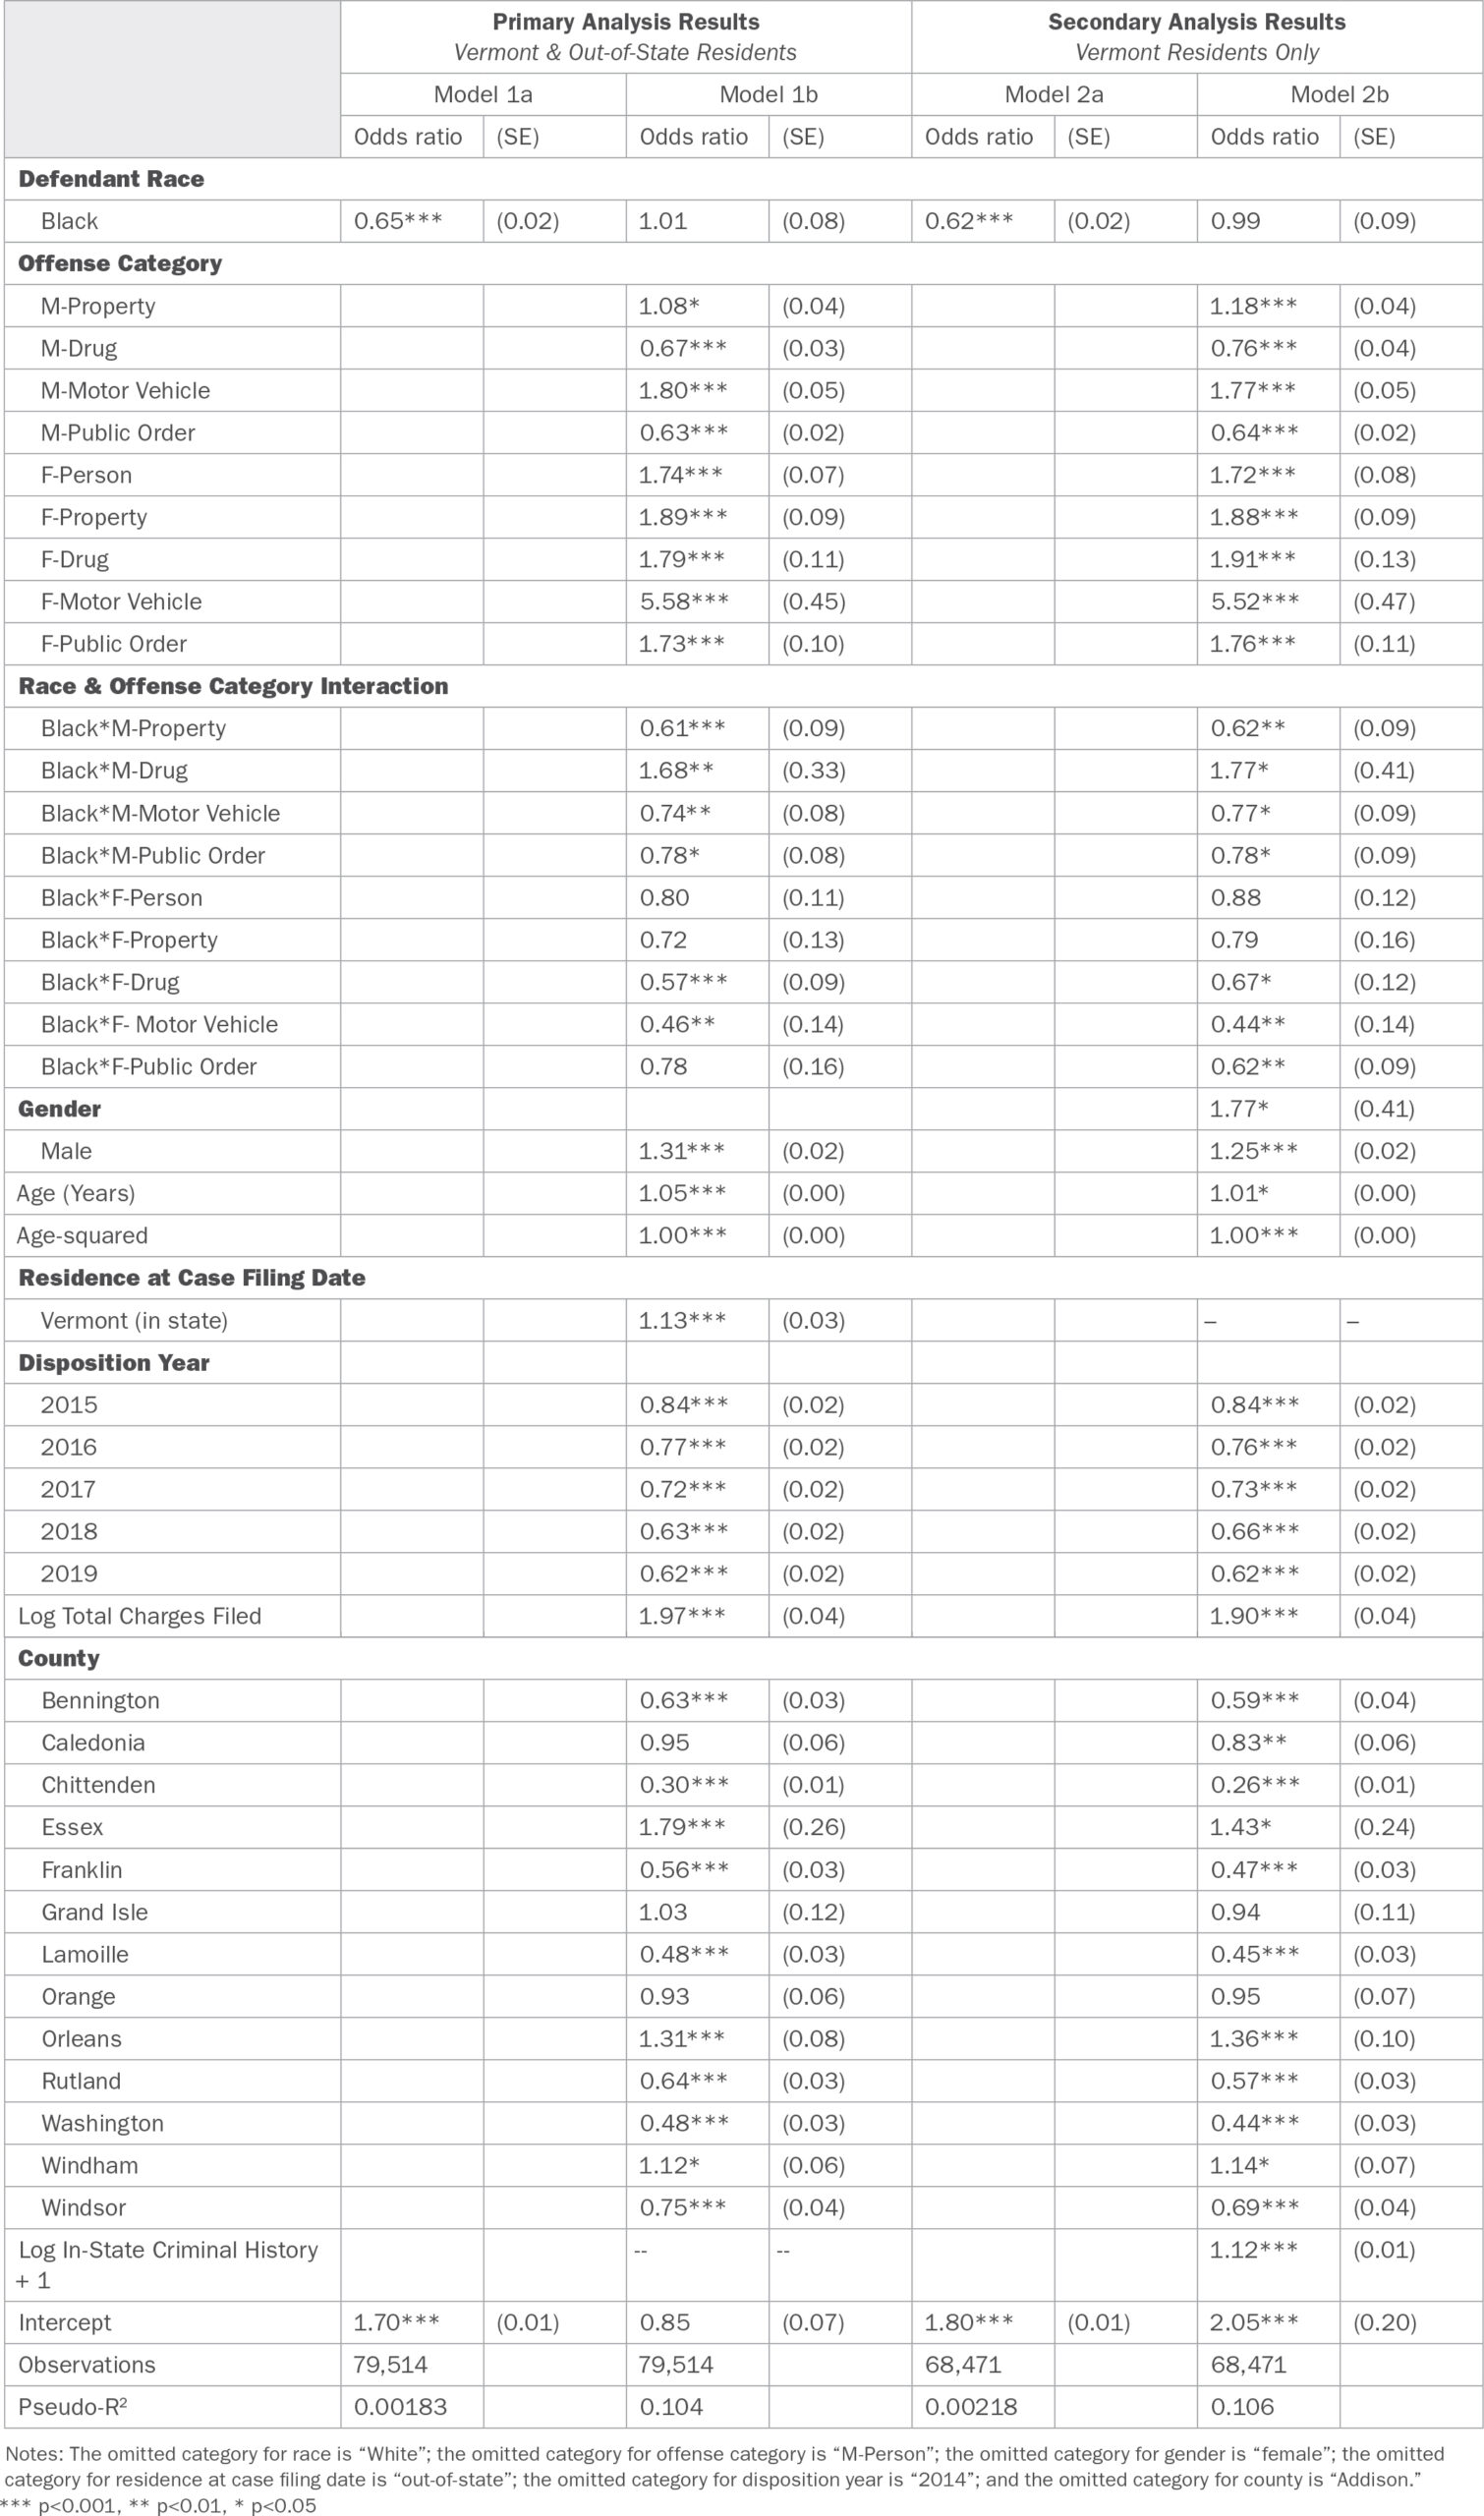
Table A9. Odds Ratios from Logistic Regression Predicting Incarceration, 2014–2019
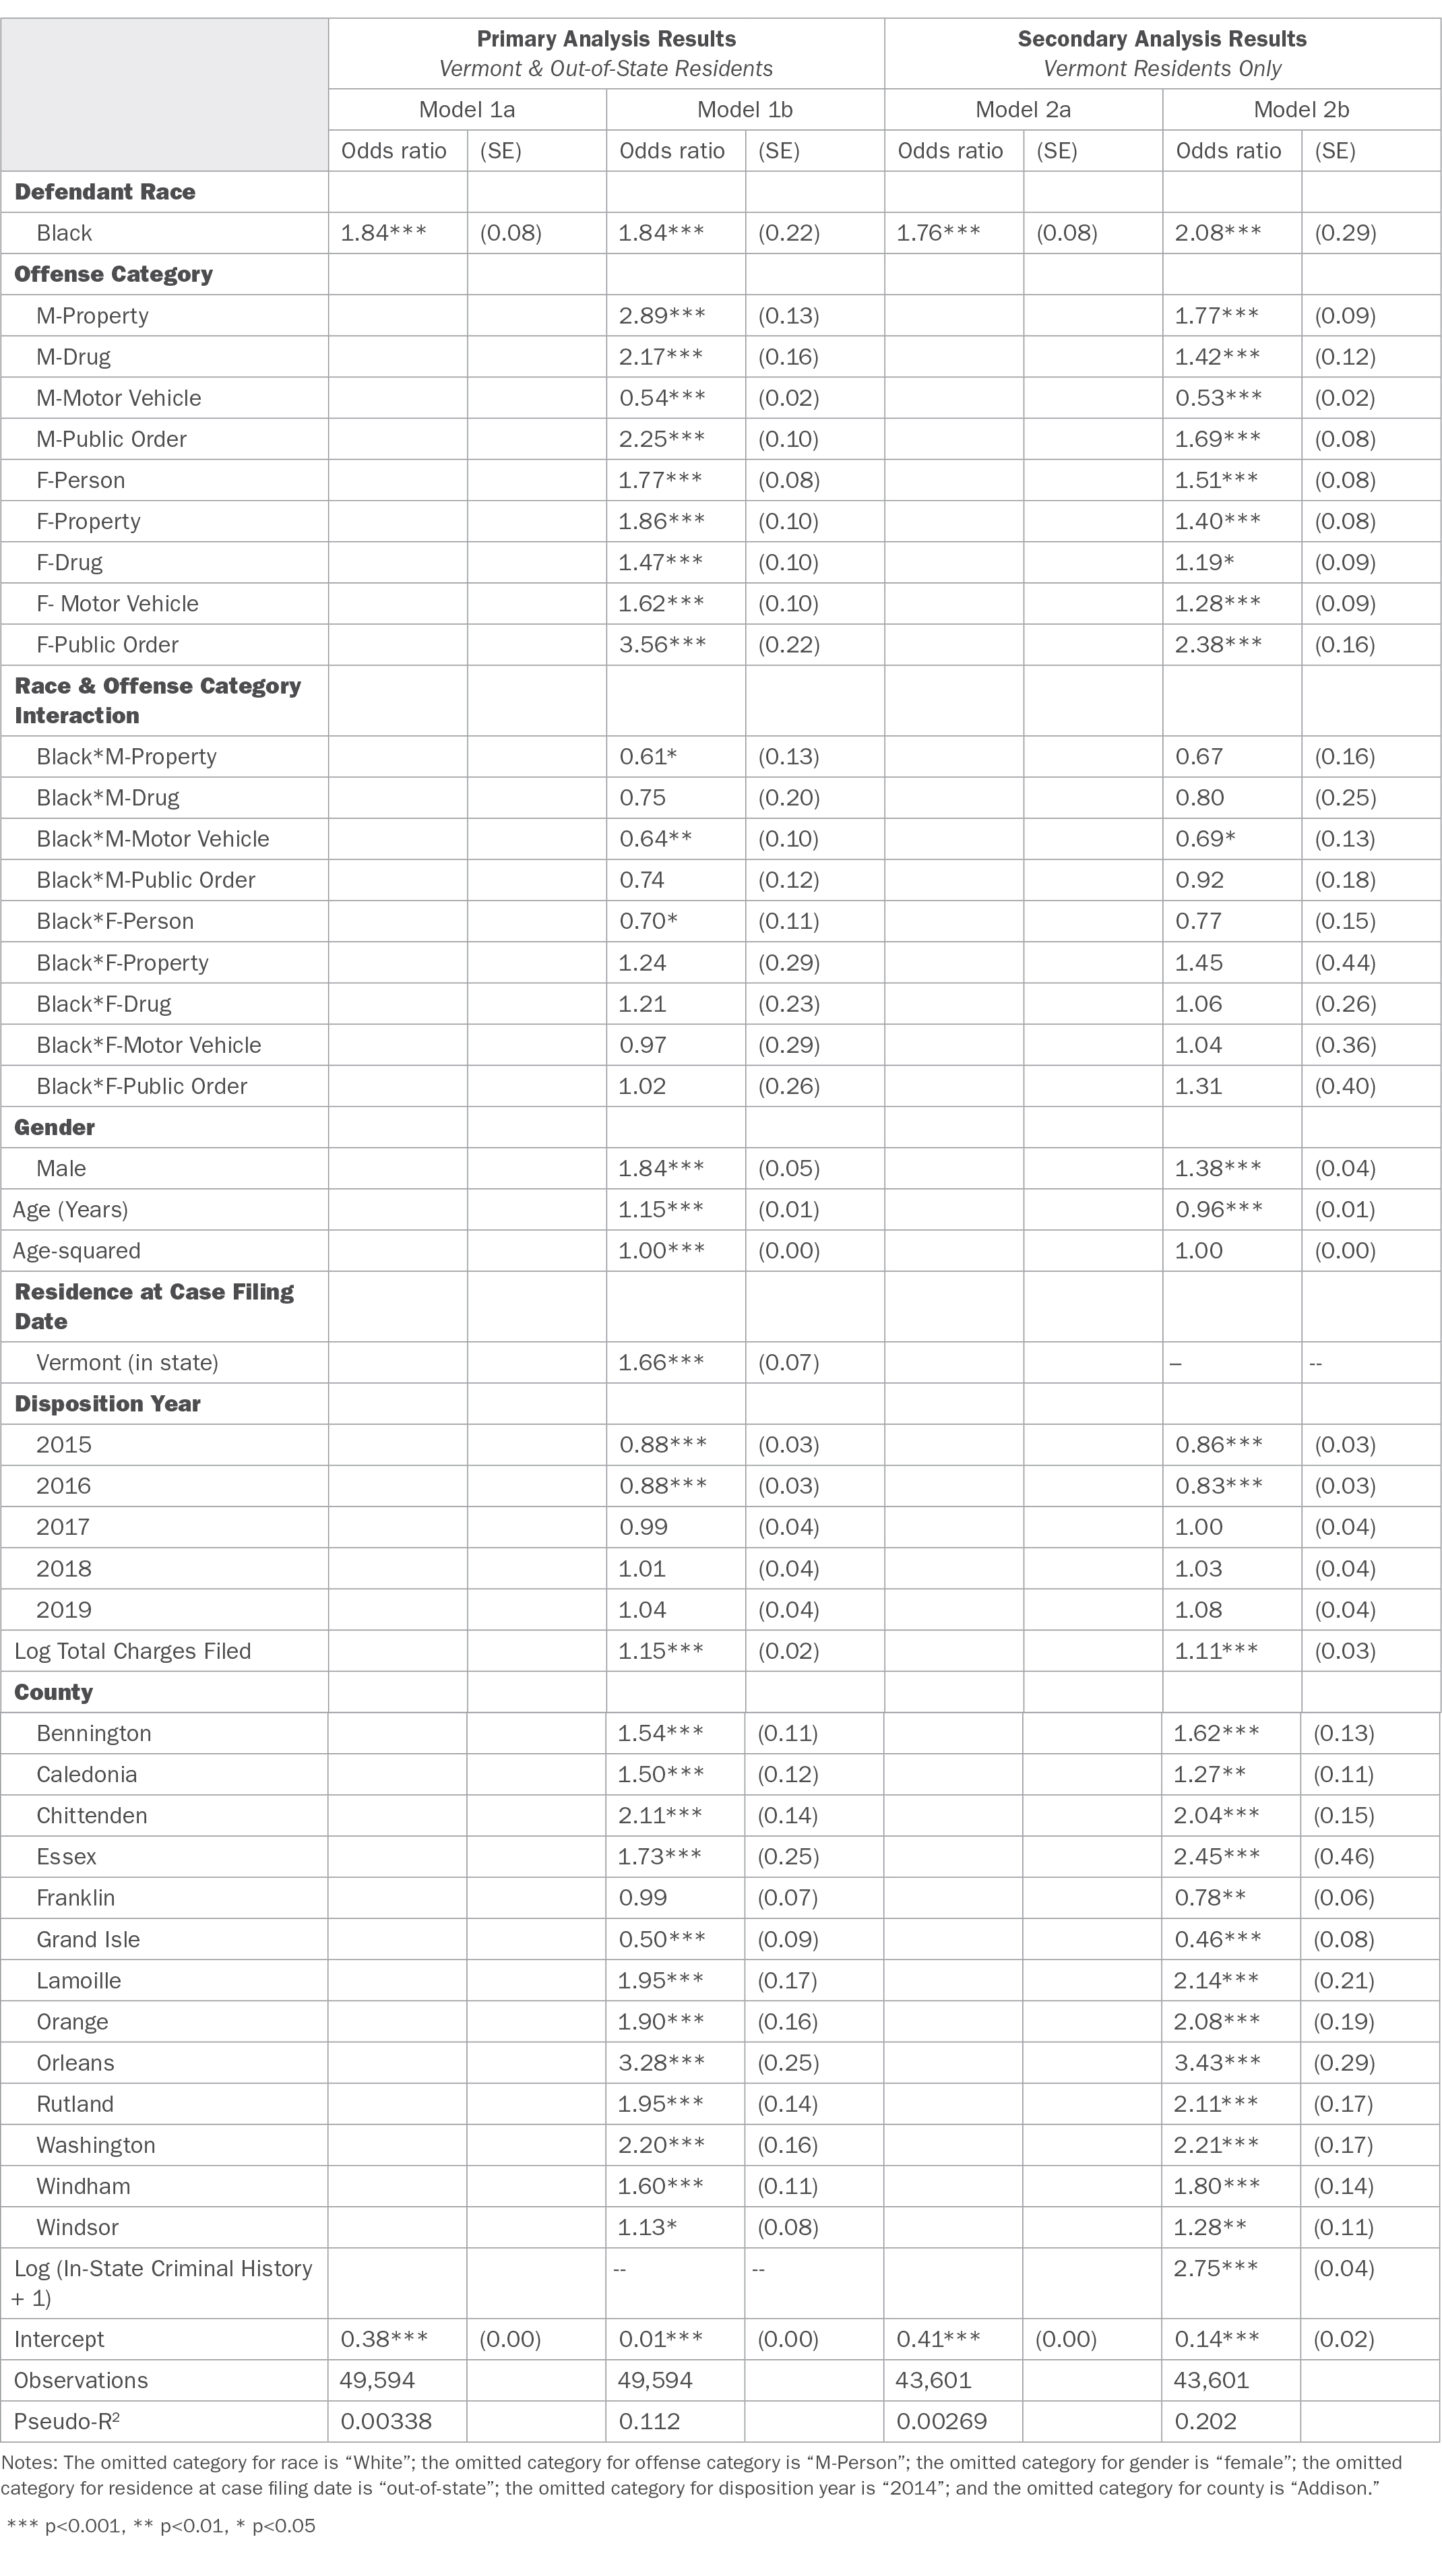
Table A10. Incident Rate Ratios (IRRs) from Negative Binomial Regression Predicting Minimum Sentenced Incarceration Length, 2014–2019
Notes
64. “State Population by Characteristics, 2010–2019,” U.S. Census Bureau.
65. Analysis of 2014–2019 Vermont Judiciary disposition data and 2010–2019 U.S. Census Bureau State Population by Characteristics data conducted by The Council of State Governments (CSG) Justice Center, November 2021.
66. Meeting between The Council of State Governments Justice Center and the Vermont Judiciary, July 15, 2021.
67. Email between The Council of State Governments Justice Center and the Vermont Crime Research Group, June 15, 2021.
68. Email between The Council of State Governments Justice Center and the Vermont Crime Research Group, May 26, 2021. Severity index provided by Vermont Crime Research Group.
69. See Robin Weber, Race and Sentencing in Vermont (Montpelier, VT: Crime Research Group, 2015). This method for constructing a total prior criminal history score was developed by the Vermont Crime Research Group.