Technical Appendix
Table of Contents
This appendix documents the technical steps that supported our assessment. For this report, we used individual-level data on people on community supervision from state criminal justice agencies, and we reviewed policy documents and interviewed stakeholders. In this appendix, we detail our data sources and methodology.
Data Collection
This policy assessment relied on public documents, interviews with stakeholders, and administrative data. Documents, policies, and reports were collected about the policies using time-limited incarceration responses to supervision violations. Stakeholders in both Nebraska and Utah participated in interviews with project staff. The administrative data used in our analysis come from two sources: Nebraska’s Administrative Office of the Courts and Probation and the Utah Department of Corrections Adult Probation and Parole. Both states provided data on people on community supervision before and after the implementation of their respective policies on time-limited incarceration responses.
Nebraska
Policy documents. For the qualitative assessment, the authors reviewed Nebraska state statutes to understand the details of the state’s violation response policy as written in addition to any other related statutes. In addition, we reviewed agency-level policies related to the use of sanctions and incentives as well as publicly available data reports and qualitative reports on reform efforts in the state.
Interview data. Informed by the statutory and policy review, we developed interview guides that were used for the stakeholder groups participating in virtual interviews individually, in small groups, or in larger focus groups. The variation in group size was driven by people’s availability to participate and their schedules. Rather than limiting who we interviewed if someone could not join a group session, we interviewed them individually to understand their role and perspective on the use of incarceration stays in response to supervision violations. The interview guide was tailored for Nebraska and for each stakeholder group. We worked in close partnership with leadership at the Administrative Office of the Courts and Probation to identify people at different levels of the agency to participate in interviews. At the beginning of each interview, we explained the purpose of the study and our funder, made clear their participation was voluntary, and received verbal consent from each participant. A total of 17 people were interviewed in Nebraska to contextualize our quantitative findings and to help us further understand the implementation, use, and perceptions of the policy. We attempted to get geographic representation to reflect different court districts and communities in the states. We could not interview judges for this study because the request to do so that we submitted to the Administrative Office of the Courts and Probation was denied.
Administrative data. The research team received individual-level administrative data on all probation and PRS terms served between October 2011 and June 2019 from the Administrative Office of the Courts and Probation. These data included separate files for supervision, demographics, violations, and sanctions. Separately, we received recidivism data that listed information on reconvictions within three years of release for people who completed probation between 2011 and 2016. Urban met multiple times with the Administrative Office of the Courts and Probation’s data analyst to discuss the sample and necessary variables and ensure understanding of the data structure and variable definitions.
Utah
Policy documents. The authors reviewed relevant Utah statutes to understand the full details of the state’s violation response policy. In addition, we reviewed agency-level policies related to Utah’s graduated response system (the Response and Incentive Matrix). We also reviewed publicly available data reports and qualitative reports on reform efforts in the state.
Interview data. Informed by the statutory and policy review, we developed interview guides that were used for the stakeholder groups participating in virtual interviews individually, in small groups, or in larger focus groups. The variation in group size was driven by people’s availability to participate and their schedules. Rather than limiting who we interviewed if someone could not join a group session, we interviewed them individually to understand their role and perspective on the use of incarceration stays in response to supervision violations. The interview guide was tailored for each stakeholder group. We worked in close partnership with leadership at the UDC Adult Probation and Parole to identify people at different levels of the agency to participate in interviews. Moreover, Adult Probation and Parole connected us with staff at Utah’s Administrative Office of the Courts to identify judges to speak with for our study. At the beginning of each interview, we explained the purpose of the study and our funder, made clear their participation was voluntary, and received verbal consent from each participant. A total of 13 people were interviewed in Utah to contextualize our quantitative findings, and to help us further understand the implementation, use, and perceptions of the policy. We attempted to get geographic representation to reflect different court districts and communities in the state. We could not interview any members of the Utah Board of Pardons and Parole because the board could not accommodate our request in time for those members to be included in the study.
Administrative data. The authors received individual-level administrative data on all probation and parole terms that started between 2010 and February 2019 from the UDC. These data included separate files for supervision, demographics, violations, sanctions, and recidivism. Urban consulted with the UDC data team to select variables for inclusion in the analysis, ensure understanding of the data structure and variable meanings, and check for accuracy and quality.
Methodology
In both states, we processed the administrative data into analysis-ready files. This included structuring the data into a single observation for each unique supervision period for each person and creating many variables, including those related to the supervision term, violations, sanctions, and recidivism. After the data were processed, descriptive analyses were conducted to understand the sample, policy implementation, and trends over time. We then conducted outcome analyses using propensity score matching to estimate the effect of the earned discharge policies on recidivism in each state. The data processing, descriptive analyses, and propensity score matching were conducted in R.
Outcome Analysis
This section describes the propensity score matching method in each state. Because each state had different earned time-limited incarceration response policies, time since implementation, and recidivism data availability, the approach for each state is different.
Nebraska
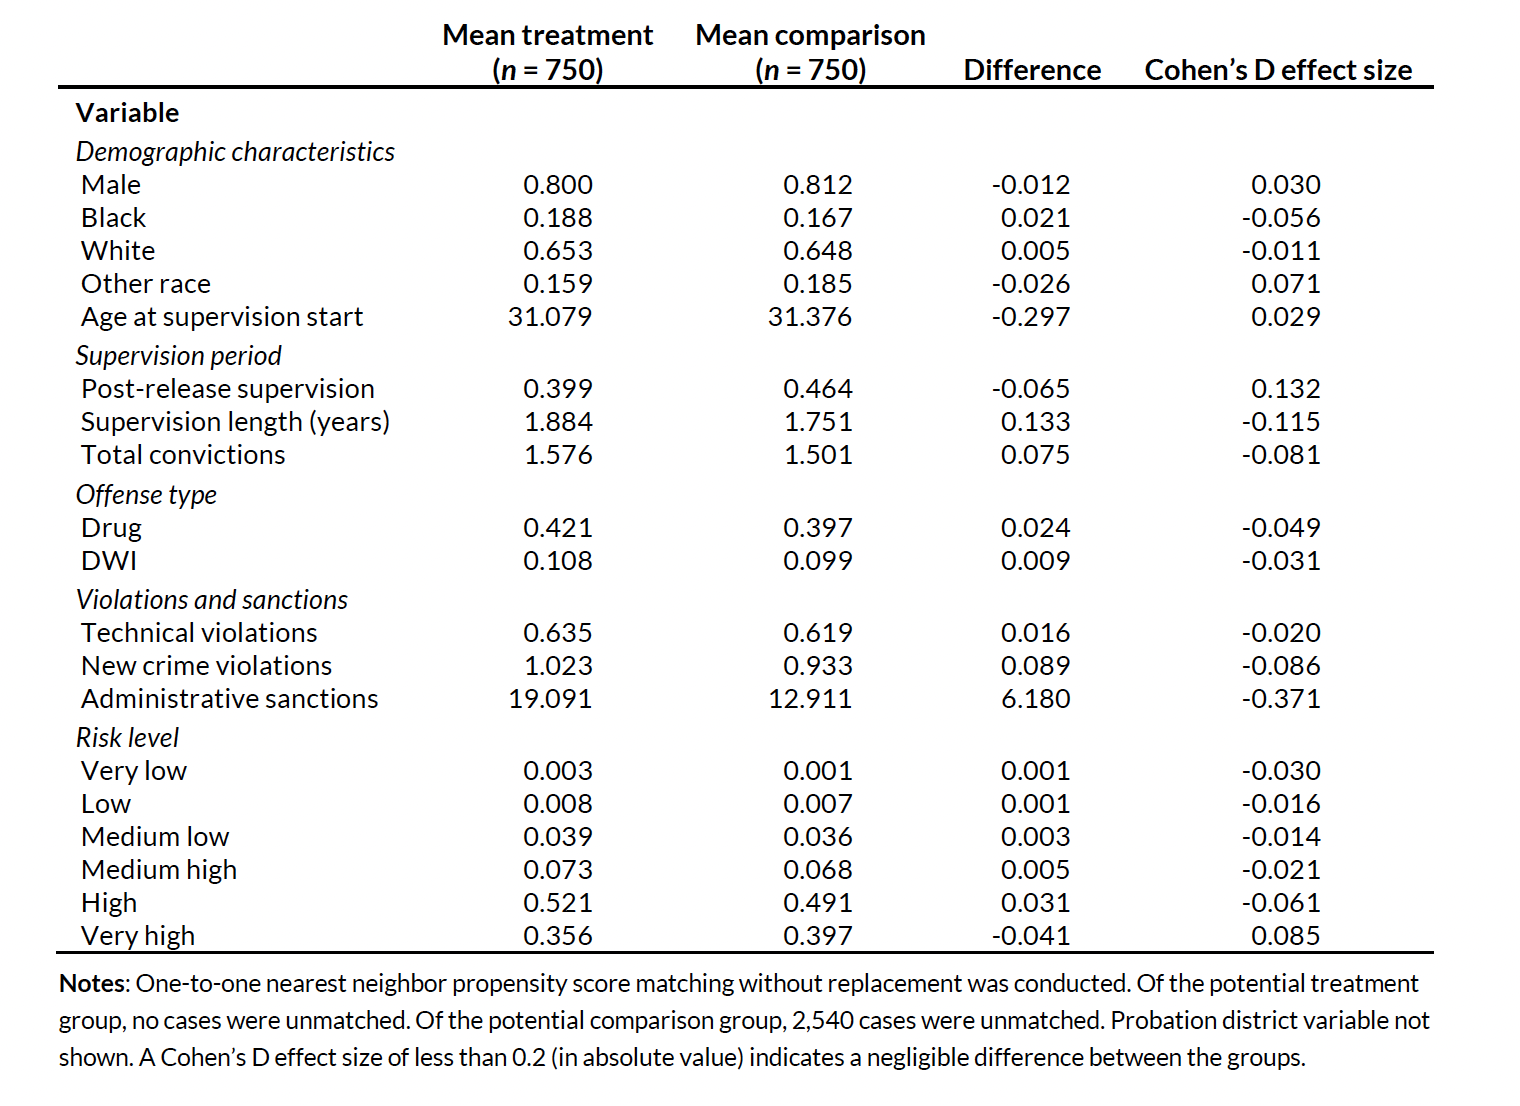
To assess the association between custodial sanctions and supervision outcomes, we conducted a propensity score matching analysis. The “treatment” group consisted of people on felony probation or PRS who served at least one custodial sanction (n = 750). The potential comparison group consisted of people on felony probation or PRS who had at least one violation during their supervision term, served no custodial sanctions, and ended supervision in 2016 or later so that they at least had some exposure to the custodial sanction policy implemented in August 2015 (n = 3,290).
We then conducted one-to-one nearest neighbor matching without replacement on demographic characteristics, offense type, supervision length, supervision type, number of technical and new-crime violations, number of administrative sanctions, risk level, and court district. There were no meaningful differences between the treatment group (n = 750) and matched comparison group (n = 750) for most variables, as measured by Cohen’s D effect size (see table A.1). After matching, a small difference remained for the number of administrative sanctions, with the treatment group receiving 19 on average and the comparison group receiving 13 on average.
Table A.1: Nebraska Matching Results
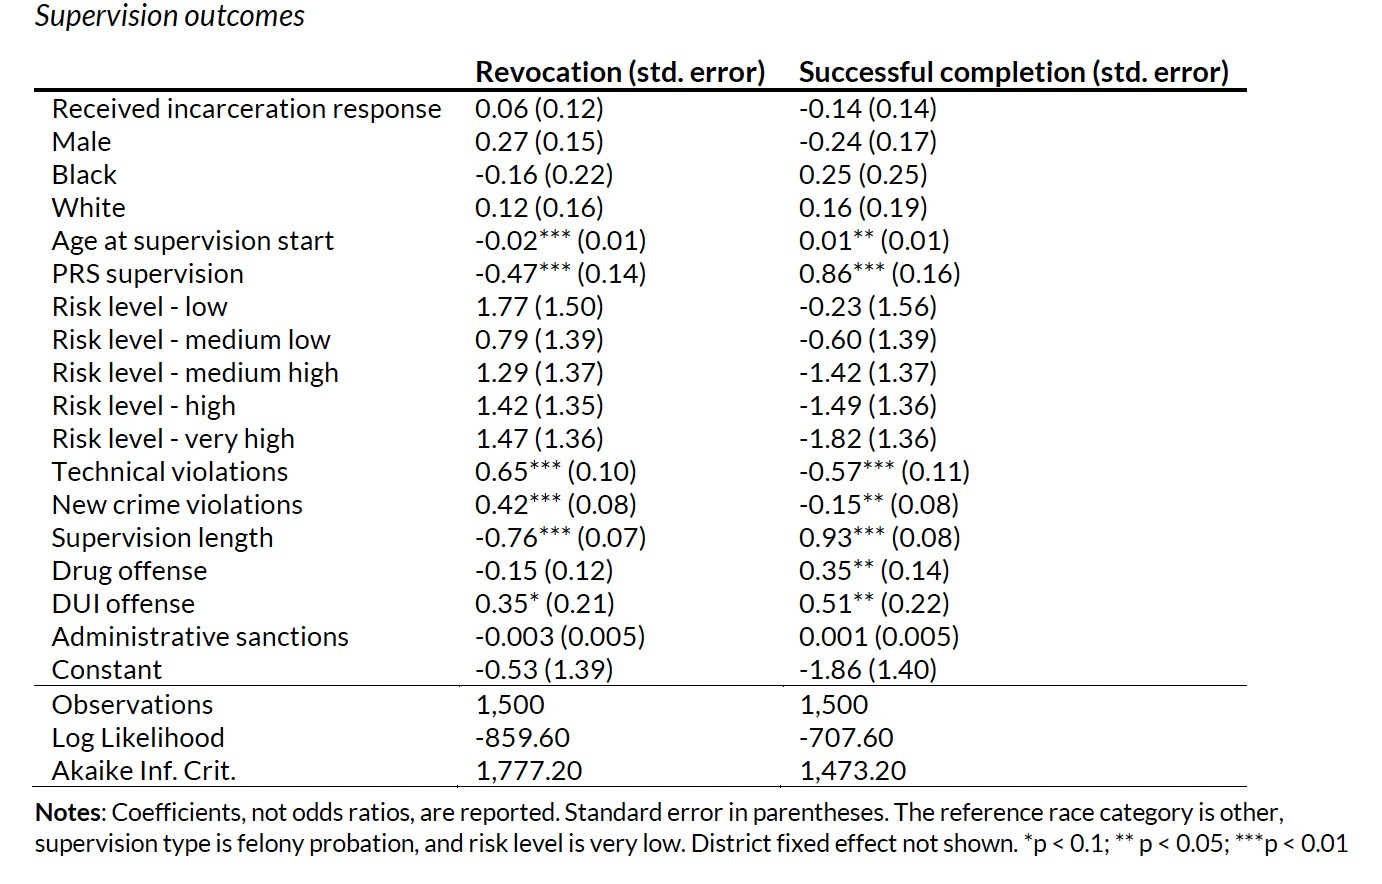
With the matched treatment and comparison groups, logistic regressions were conducted to assess the effect of custodial sanctions on supervision outcomes. We focus on the outcomes of successful supervision completion and revocation. We are unable to evaluate recidivism outcomes because we only had recidivism data for people discharged by the end of 2016, and given that the custodial sanction policy began in August 2015, only about 100 people who had received custodial sanctions had been discharged and had recidivism information available. The regression models included the listed matching criteria as control variables.
Utah
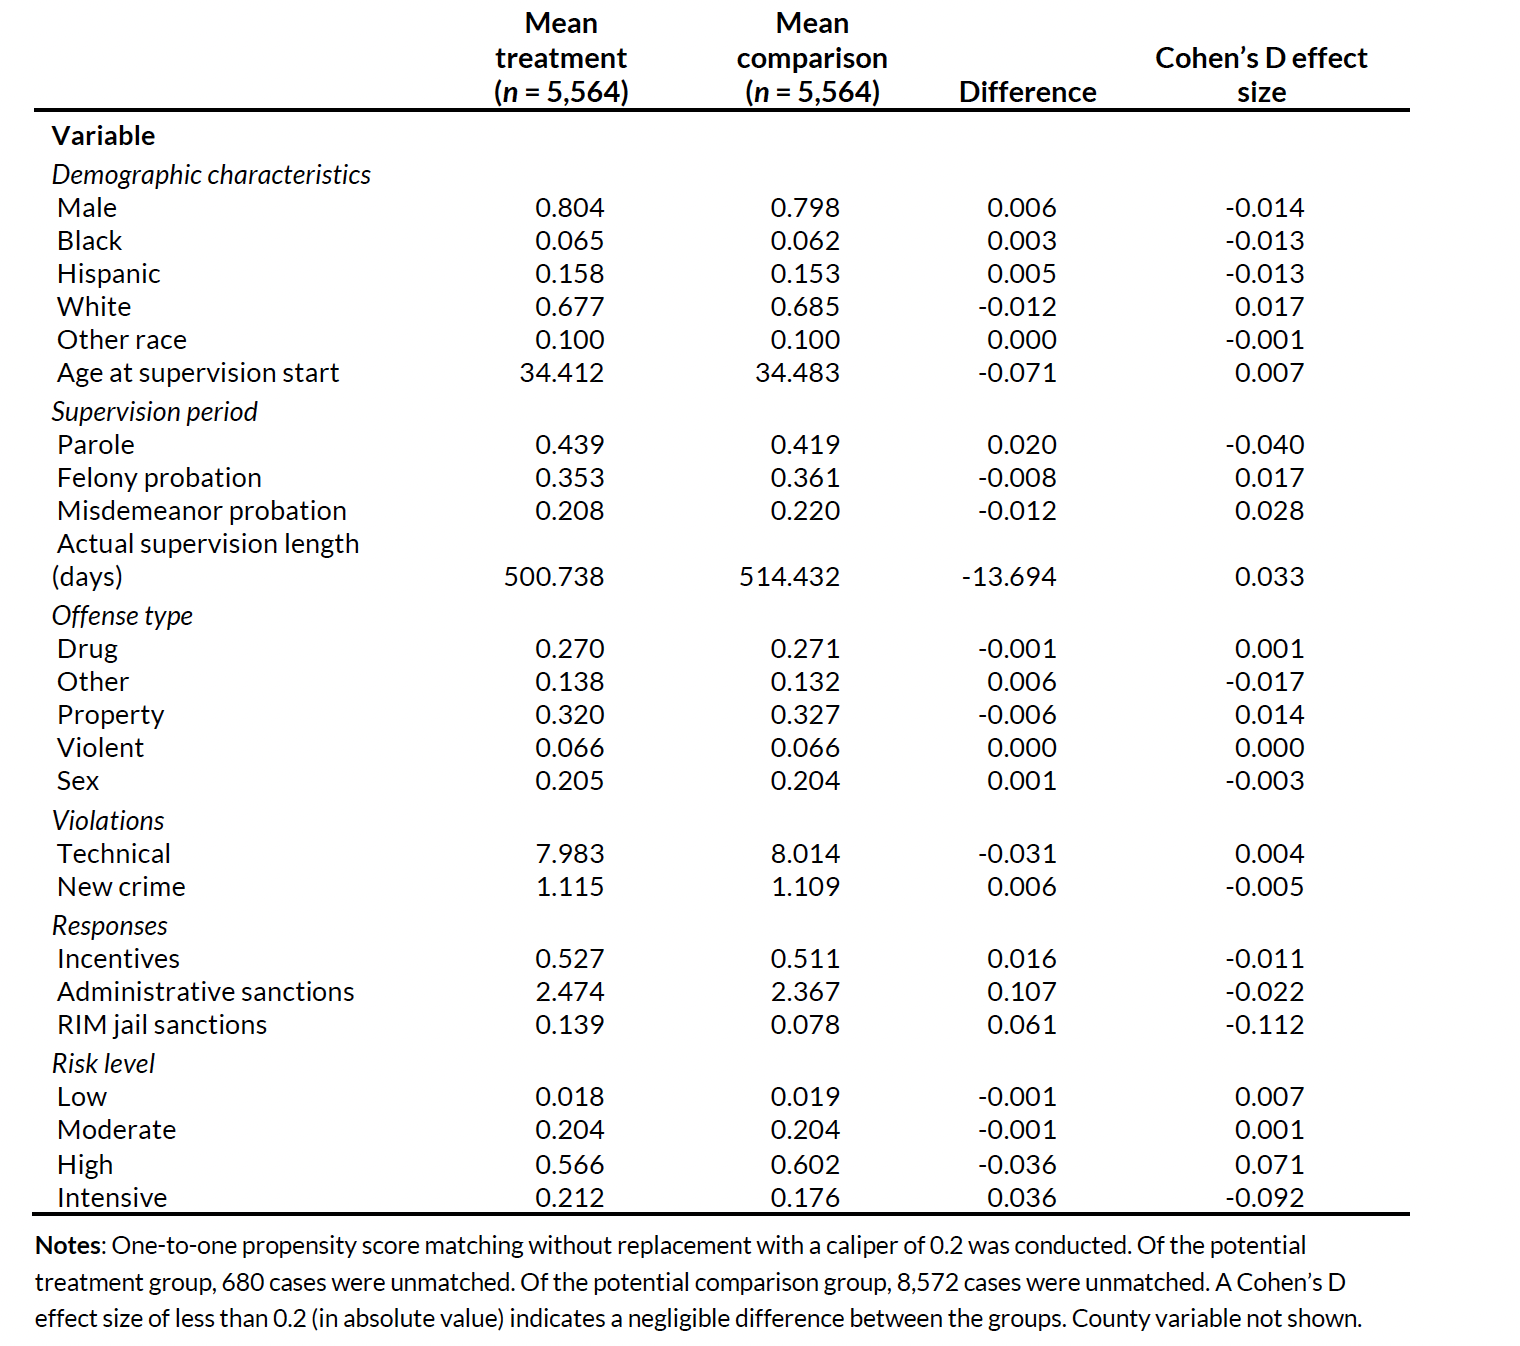
To assess the effect of incarceration responses on recidivism, Urban conducted a propensity score matching analysis. The “treatment” group was composed of people on probation or parole who received at least one graduated incarceration cap and ended supervision between 2016 and February 2019 (n = 6,244). The potential comparison group consisted of people on probation or parole who had at least one violation during their supervision term, received no graduated incarceration caps, and ended supervision between 2016 and February 2019 so that they at least had some exposure to the custodial sanction policy implemented in October 2015 (n = 14,136). We limit both the treatment and comparison groups to those who ended supervision through February 2019 to allow for one year of recidivism follow-up time.
After one-to-one matching without replacement on demographic characteristics, offense type, supervision length, supervision type, number of technical and new-crime violations, number of administrative and RIM jail sanctions, RIM incentives received, risk level, and county, there were no substantial differences, as measured by Cohen’s D effect size, between the treatment group (n = 5,564) and matched comparison group (n = 5,564; see table A.2).
Table A.2: Utah Matching Results
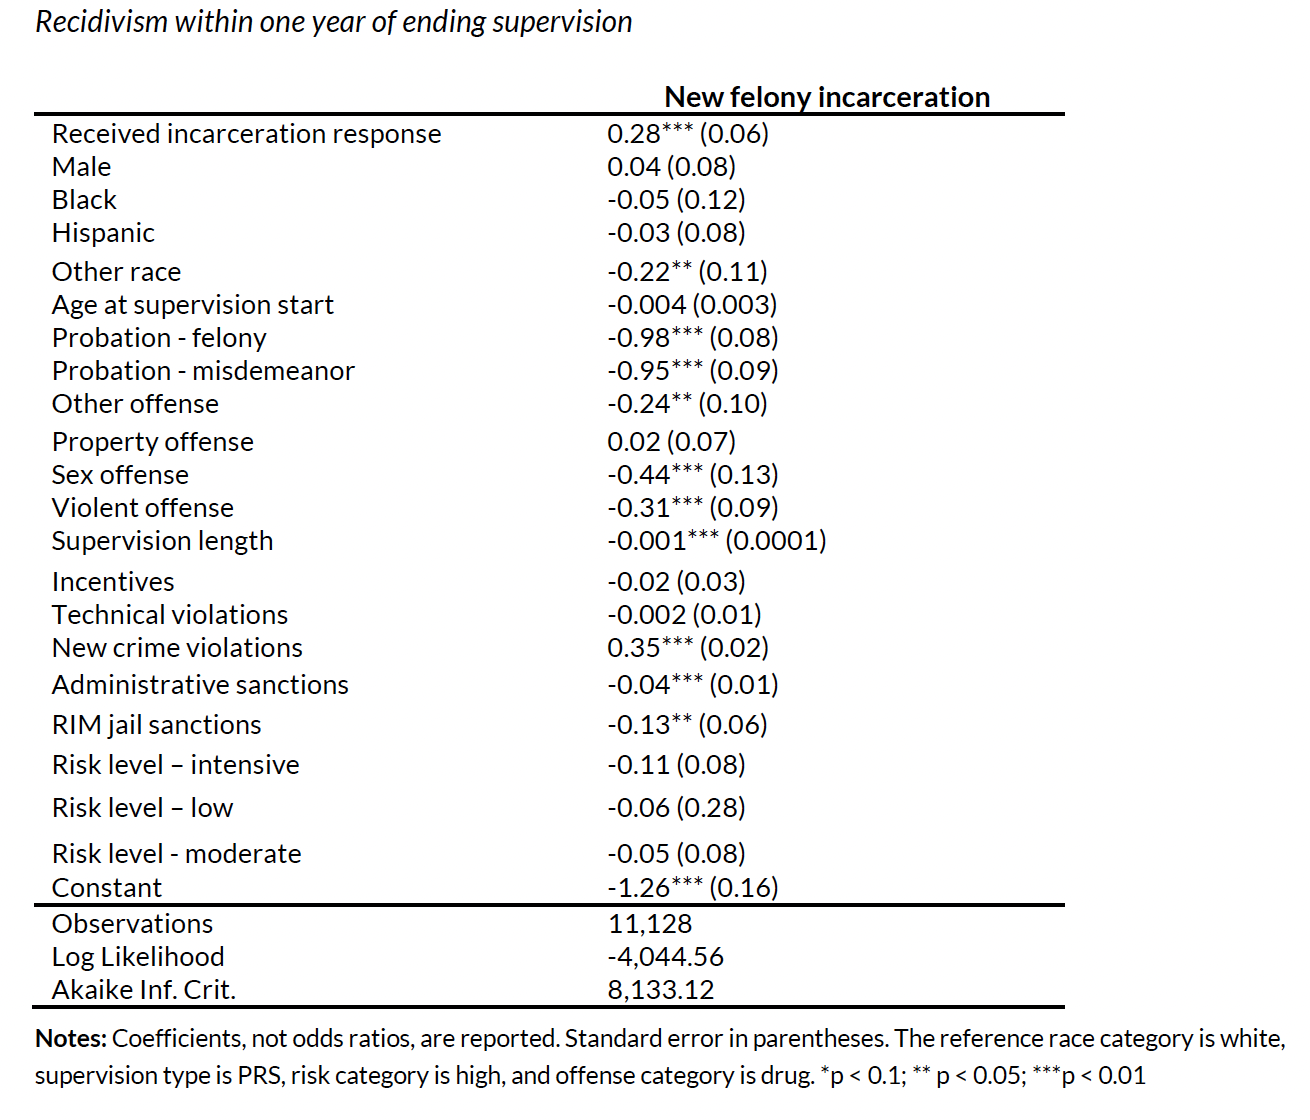
With the matched treatment and comparison groups, logistic regressions were conducted to assess the effect of receiving incarceration responses on recidivism as measured by a referral to the UDC with a new felony conviction within one year of ending supervision. The models included the listed matching criteria as control variables. We then estimate the predicted recidivism rate for both the treatment and comparison groups with the models.
Results
This section reports the results of the logistic regression analyses conducted after the treatment and comparison groups had been constructed using propensity score matching. Since the comparison and treatment groups and outcome definitions are different in each state, the results of the outcome analysis for each state should not be compared directly.
Nebraska
After matching and controlling for relevant factors, people who received incarceration responses are no more likely or unlikely to successfully complete supervision or be revoked (see table A.3). Because the regression analyses show no effect of incarceration responses, we conduct chi-square tests to assess any differences in successful completion and revocation rates. There were no significant differences between those who received custodial sanctions and the matched comparison group in rates of successful completion (26.5 percent versus 27.3 percent) or revocation (60.5 percent versus 59.7 percent). When compared with people who do not serve a custodial sanction for their violations and who have similar characteristics, receiving a custodial sanction is not associated with any differences in revocation or successful completion of supervision.
Table A.3: Nebraska Logistic Regression Results
Utah
After matching and controlling for relevant characteristics, those who received incarceration responses are significantly more likely to be convicted for a new felony and referred to the UDC within one year of release from supervision (see table A.4). With the model, we then estimate the rate of a felony conviction and referral to the UDC for each group. The estimated rate among those who received a graduated incarceration cap was 23 percent, compared with 18 percent for the matched comparison group. When compared with people who did not receive a graduated incarceration cap for their violations and who had similar characteristics, receiving a graduated incarceration cap was associated with a significantly higher rate after ending supervision.
Table A.4: Utah Logistic Regression Results