An Assessment of Community Supervision Incarceration Responses in Nebraska and Utah
Table of Contents
Many states have enacted comprehensive reforms to reduce unnecessary incarceration and community supervision as a way to focus funding on people at higher risk of reoffending and invest in strategies to achieve better outcomes. Many of these policy reforms have been spurred by significant growth in the number of people on community supervision. According to a 2018 Pew Charitable Trusts chartbook, probation and parole populations nationwide grew 239 percent from 1980 to 2016 (Horowitz, Utada, and Fuhrmann 2018). Notably, community supervision populations peaked in 2007 and fell 11 percent between 2007 and 2016.1 To date, research on the impact of states’ community supervision policy changes has not kept pace with the rate at which they have been enacted, leaving policymakers and practitioners with a knowledge gap regarding which reforms have made a difference and why.
The Urban Institute and the Crime and Justice Institute (CJI) conducted an assessment of how states have implemented reforms to more effectively respond to violations of supervision. One such reform focuses on the use of incarceration stays that are shorter than full revocations of supervision would be, in response to violations of supervision to improve community corrections outcomes at the individual and system levels. These time-limited incarceration stays are sometimes referred to as custodial sanctions, jail stays, graduated incarceration responses, and caps of revocation time for first, second, or third violations. They can include short jail stays of one to three days in jail or prison stays of set periods ranging from 10, 15, 30, and up to 180 days. States that implement this policy aim to reduce the number of full revocations to prison and the amount of time people spend incarcerated compared with people who receive full revocation. To improve supervision outcomes, they also seek to improve people’s behavior on supervision by enacting these responses faster and with more certainty than longer revocation processes, aiming to then reduce new crimes committed during or after supervision.
Research shows that longer prison sentences do not produce better community safety outcomes (such as lower rates of reoffending) than shorter ones. Incarceration stays are expensive, and shorter sentences save resources that can be used on more effective approaches to improving community safety. Further, research indicates that the surety of a sanction occurring has more impact than how severe the sanction is. Moreover, research shows that incarceration has negative impacts on community safety. For instance, people on probation who had received an incarceration sanction had higher recidivism rates than people on probation who had received nonincarceration sanctions (The Pew Charitable Trusts 2019). Further, a meta-analysis of 116 studies showed that “custodial sanctions have no effect on reoffending or slightly increase it when compared with the effects of noncustodial sanctions such as probation (Petrich, Pratt, Jonson and Cullen 2021).”
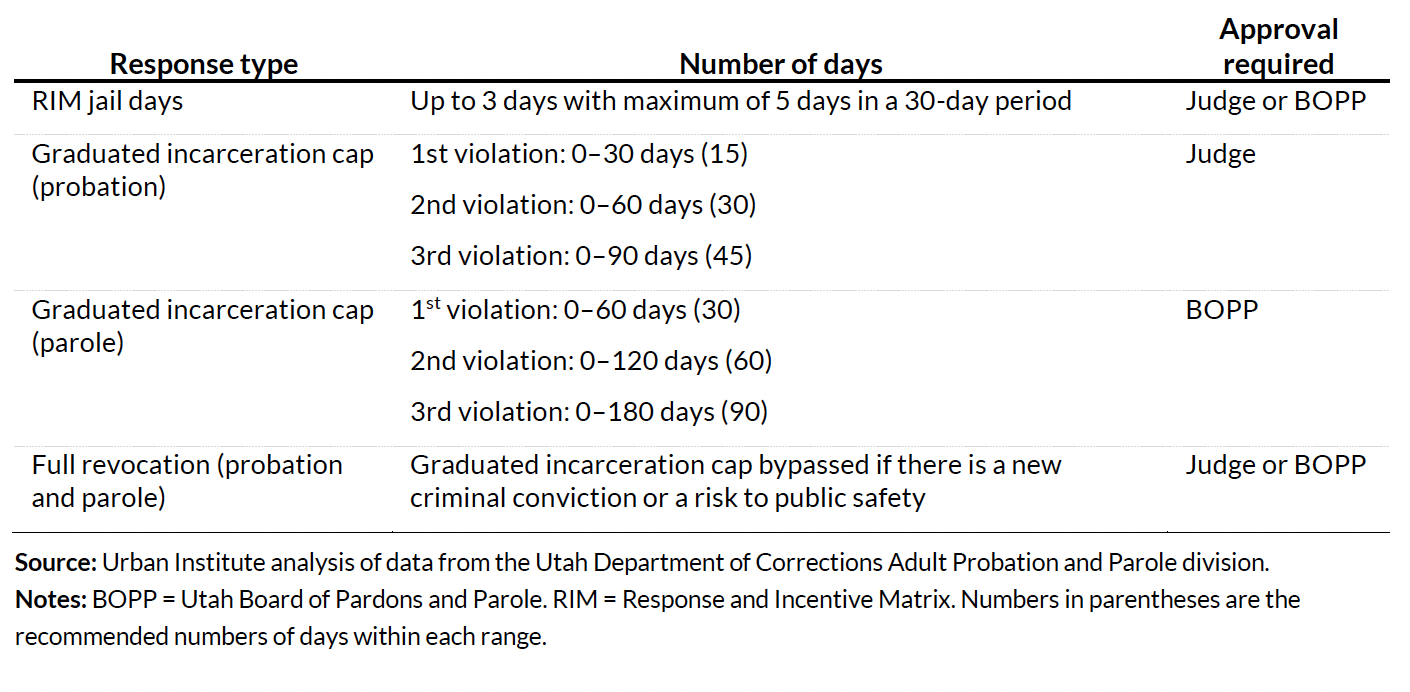
States have implemented different strategies to limit the amount of time people spend incarcerated because of supervision violations. Typically, the use of incarceration as a response to a violation is part of a broader continuum, or matrix, of graduated responses used to address compliance and noncompliance with supervision terms. For instance, as part of its incentives and sanctions matrix, Nebraska implemented custodial sanctions as a response to probation violations. The most severe custodial sanction there is a jail stay of up to 30 days and the second most severe custodial sanction is a jail stay of up to 3 days; formal revocation is pursued only when someone has served 90 days of cumulative custodial sanctions. Moreover, Utah developed a system of graduated sanctions and incentives that includes tiered levels of incentives, and it established a policy whereby for probation violations, short jail stays are available along with capped terms of incarceration of up to 30 days for a first violation, 60 days for a second violation, and 90 days for a third violation. For people on parole in Utah, the matrix allows up to 60 days for a first violation, 120 days for a second violation, and 180 days for a third violation. Urban and CJI analyzed implementation and outcomes of both states’ policies.
This assessment explores three research questions in each state:
- How have the incarceration responses to violations been implemented as part of a broader supervision reform effort?
- What has changed during the implementation of incarceration responses for metrics such as supervision violations, revocation, successful completion, and recidivism?
- What are the observed associations between outcomes and receiving custodial sanctions?
Nebraska
In 2013, Nebraska’s prison population was increasing and its prisons were over capacity (Council of State Governments Justice Center 2015a). The state engaged in a data-driven process to understand the reasons for this growth. It found that better use of supervision was an important component of addressing prison growth and overcapacity.
In 2015, Governor Ricketts signed L.B. 605, which contained several changes to the state’s prison and community supervision systems. These changes included allowing for a short custodial stay before revocation, referred to as a custodial sanction. In this report, we examine the impact of Nebraska’s custodial sanctions. Using data from the Nebraska Administrative Office of the Courts and Probation’s case management system, we examine the implementation of custodial sanctions and its impact on revocations and successful completions for people supervised on probation and post-release supervision (PRS). Key findings include the following:
- Since 2016, Nebraska has administered more than 5,000 custodial sanctions, with about a fifth of people starting felony probation or PRS in 2018 receiving at least one.
- Case management terms2 with custodial sanctions are associated with higher levels of violations and more serious violations than case management terms without custodial sanctions.
- After implementation, for the entire felony probation population, successful completions of supervision increased and revocations for technical violations decreased.
- Analysis of a set of matched individual case outcomes shows no significant differences in rates of successful supervision completion between cases that received custodial sanctions and those that did not.
Background on Custodial Sanctions in Nebraska
Nebraska’s prison population increased 19 percent from 2004 to 2013. Importantly, in 2014 the state’s prison facilities were operating at 159 percent of capacity and were expected to reach 170 percent by 2020 if policy changes did not occur (Council of State Governments Justice Center 2015a).
In 2015, Nebraska passed L.B. 605 as part of its participation in the Justice Reinvestment Initiative (JRI). Through this bill, state leaders sought to address prison population growth and strengthen community supervision through several means. One way was increasing the use of probation, particularly through the introduction of presumptive probation as a response for some felony convictions, instead of prison. Another way was establishing PRS after prison stays. The state created PRS to require supervision for those who were exiting prison and jail with no supervision. This population generally comprised people who were convicted of lower-level felonies and who were at higher risk of recidivating. The legislation also included further developing a matrix of rewards and sanctions (including administrative and custodial sanctions) for people on supervision and allowing early release from supervision based on compliance (Courtney and Harvell 2019; Council of State Governments Justice Center 2015b).
The policy introducing custodial sanctions had several key components and was intended not only to improve responses to violations of supervision—particularly technical violations—but also to reduce full revocations to prison or jail, thereby reducing the pressure on prison capacity. It capped the amount of time a person could be held in custody as a sanction for a violation of supervision guidelines. A custodial sanction can be from 1 to 30 days in jail. Before a person can be revoked to prison or jail, 90 days of custodial sanctions must be used first. Custodial sanctions were implemented for people on felony probation, PRS, and parole. Our analysis focuses on custodial sanctions used for people on felony probation and PRS (box 1). The probation and PRS populations are overseen by the Administrative Office of the Courts and Probation, which is part of the Nebraska judicial branch. Parole, which is overseen by the Nebraska Board of Parole and the Division of Parole Supervision, is not part of this assessment, and we did not analyze or access data on parole.
Our analysis uses Administrative Office of the Courts and Probation data from fiscal years 2012 through 2019.3 We examine individual-level data including information on supervision characteristics, sentence length, violations, use of administrative and custodial sanctions, discharge and completion, recidivism, and demographics. In addition, we examine information gathered through three virtual focus groups held with probation administrators, supervisors, and officers (17 people in total). The data used for this analysis have limitations. These include not having data on prison admissions and lengths of stay for full revocations. Moreover, the research team could not conduct interviews with all the stakeholders of interest, including people who are serving supervision terms or who have served terms since the policy change.
For Nebraska, we asked the following research questions:
- How has the custodial sanction policy been implemented as part of a broader supervision-reform effort?
- What has changed during the implementation of custodial sanctions for metrics such as supervision violations, revocation, successful completion, and recidivism?
- What are the observed associations between supervision outcomes and receiving custodial sanctions?
Box 1
The Impacted Population in Nebraska
Custodial sanctions are used in Nebraska for people on felony probation and people on PRS. Though the maximum felony probation term in Nebraska is five years, PRS terms vary by level of felony conviction (maximum terms can be one or two years) and are served after people complete terms of imprisonment. Moreover, the PRS and felony probation populations are overseen and supervised by the Administrative Office of the Courts and Probation. Roughly the same number of people started felony probation terms in 2016 and in 2019, but between 2015 and 2019, the amount of time people served on felony probation terms increased almost 30 percent, from 1.8 to roughly 2.3 years. In addition, in 2016, the state began supervising people on PRS, with 569 starting that year and 1,610 starting in 2019. Whereas in 2015 there were only 2,287 felony new probation terms, by 2019, there were 3,462 felony new probation terms and new PRS terms. Felony probation and PRS starts combined increased more than 50 percent during this period.
In terms of risk, large shares of the PRS and felony probation populations are categorized as high or very high risk: in 2019, 89 percent of the PRS population was categorized as high or very high risk, and 63 percent of the felony probation population was categorized as such. This was a large increase from 2015, when only 54 percent of the felony probation population was deemed high or very high risk. In terms of demographics, compared with the felony probation population, the PRS population has a greater share of men (80 versus 71 percent) and Black people (22 versus 16 percent).
Source: Urban Institute analysis of data from the Nebraska Administrative Office of the Courts and Probation.
Findings on Custodial Sanctions in Nebraska
Nebraska Has Administered More Than 5,000 Custodial Sanctions
Nebraska has designed a robust custodial sanctions policy and process. Starting in August 2015, people on felony probation and people on PRS could receive custodial sanctions. The process for using a custodial sanction is as follows. First, a person is alleged to have violated the terms of their supervision. Next, they can admit to the violation, consent to the custodial sanction, and waive a hearing. If they do so, the court will approve or deny the custodial sanction. If the court denies the custodial sanction, it will issue a ruling and instructions, but if it approves the sanction, it will issue instructions for the time, date, location, and duration of the custodial sanction. If the person does not admit to the violation or admits to the violation but declines to agree to the custodial sanction, a court date will be set within 10 judicial days for the judiciary to approve or deny.
L.B. 605 limits how long an individual can be held in custody as a sanction for a violation of supervision guidelines. A custodial sanction can be between 1 and 30 days of incarceration, and 90 days of custodial sanctions must be served before someone can be revoked to prison or jail.
Nebraska documents and reports on the use of custodial sanctions. From the law’s enactment through June 2020, more than 5,000 custodial sanctions were served. During that period, 6,046 applications for custodial sanctions were submitted by probation officers. In only 409 cases did the person on supervision request a court hearing, meaning roughly 7 percent of applications for custodial sanctions received a hearing. This rate has remained consistent, increasing from 5 percent in FY 2016 to 7 percent in FY 2019. In 5,637 (93 percent) of the cases, the person on supervision agreed to the probation officer’s sanction. In total, 5,396 custodial sanctions have been approved by the courts, 64 have been changed, and 71 have been denied.
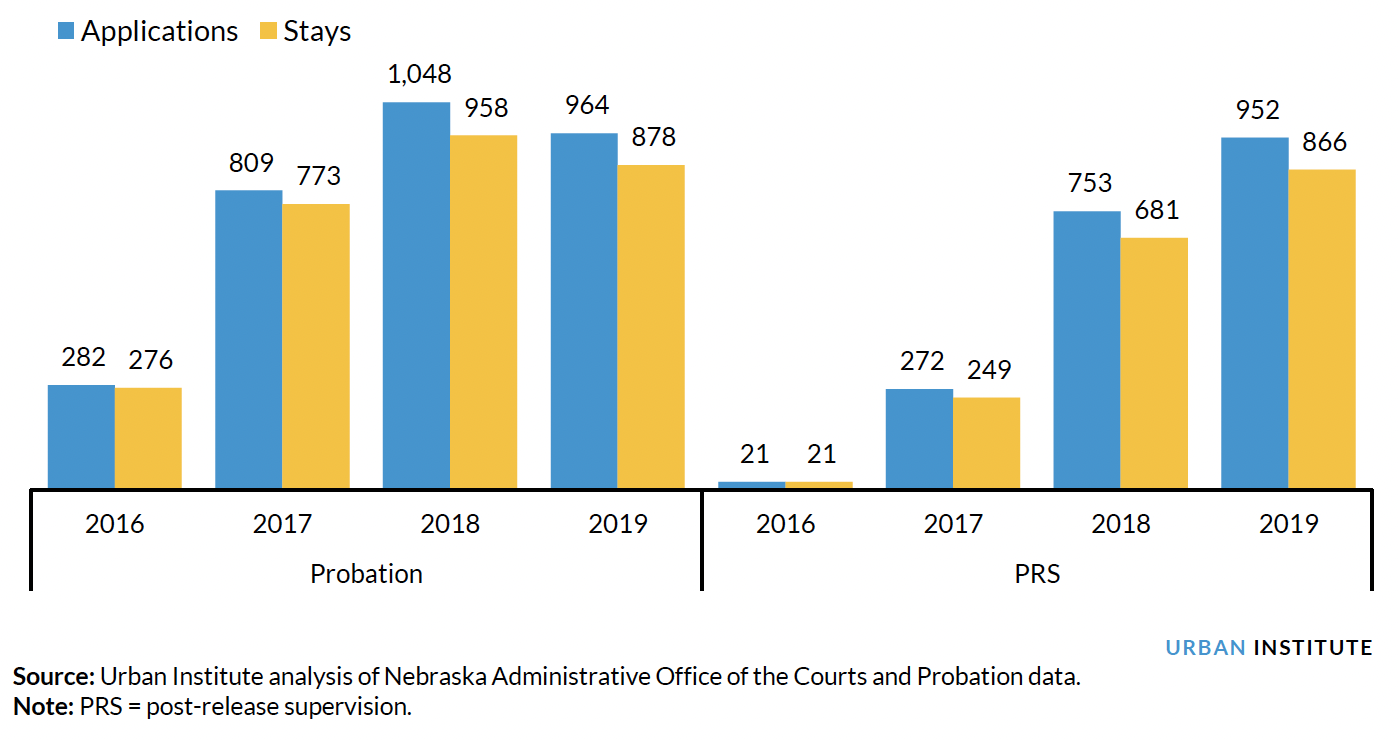
Roughly 1,700 custodial sanctions were served in 2019, and they were distributed roughly equally among the felony probation and PRS populations. For the felony probation and PRS populations beginning supervision in 2018, 20 and 21 percent, respectively, have received custodial sanctions. As figure 1 shows, in 2019, the number of custodial sanctions applied for and served had increased for both populations since custodial sanctions were introduced in 2016.
Figure 1: Total Custodial Sanctions for Felony Probation (Left) and PRS (Right) in Nebraska, FY 2016–19
In practice, from the start of the policy through 2019, the two custodial sanction durations most frequently requested were 3 days and 30 days. Further analysis showed that first custodial sanctions were most often 3 days for probation and PRS: roughly 39 percent of first custodial sanctions requested during a probation case management term and 31 percent of first custodial sanctions requested during a PRS case management term were for 3 days. Part of L.B. 605 included implementation of a response matrix designed to apply a graduated approach to redirecting noncompliant behaviors and incentivizing positive behavior. Officers are trained to use sanctions to redirect noncompliant behavior with the least punitive intervention and increase gradually if clients fail to comply. Although the two most common custodial sanction terms are 3 days and 30 days, officers are also issuing custodial sanctions for other durations of up to 30 days (table 1).
Table 1: Frequency of Custody Durations for Custodial Sanctions among Nebraska’s Probation and PRS Populations, August 2015 through FY 2019
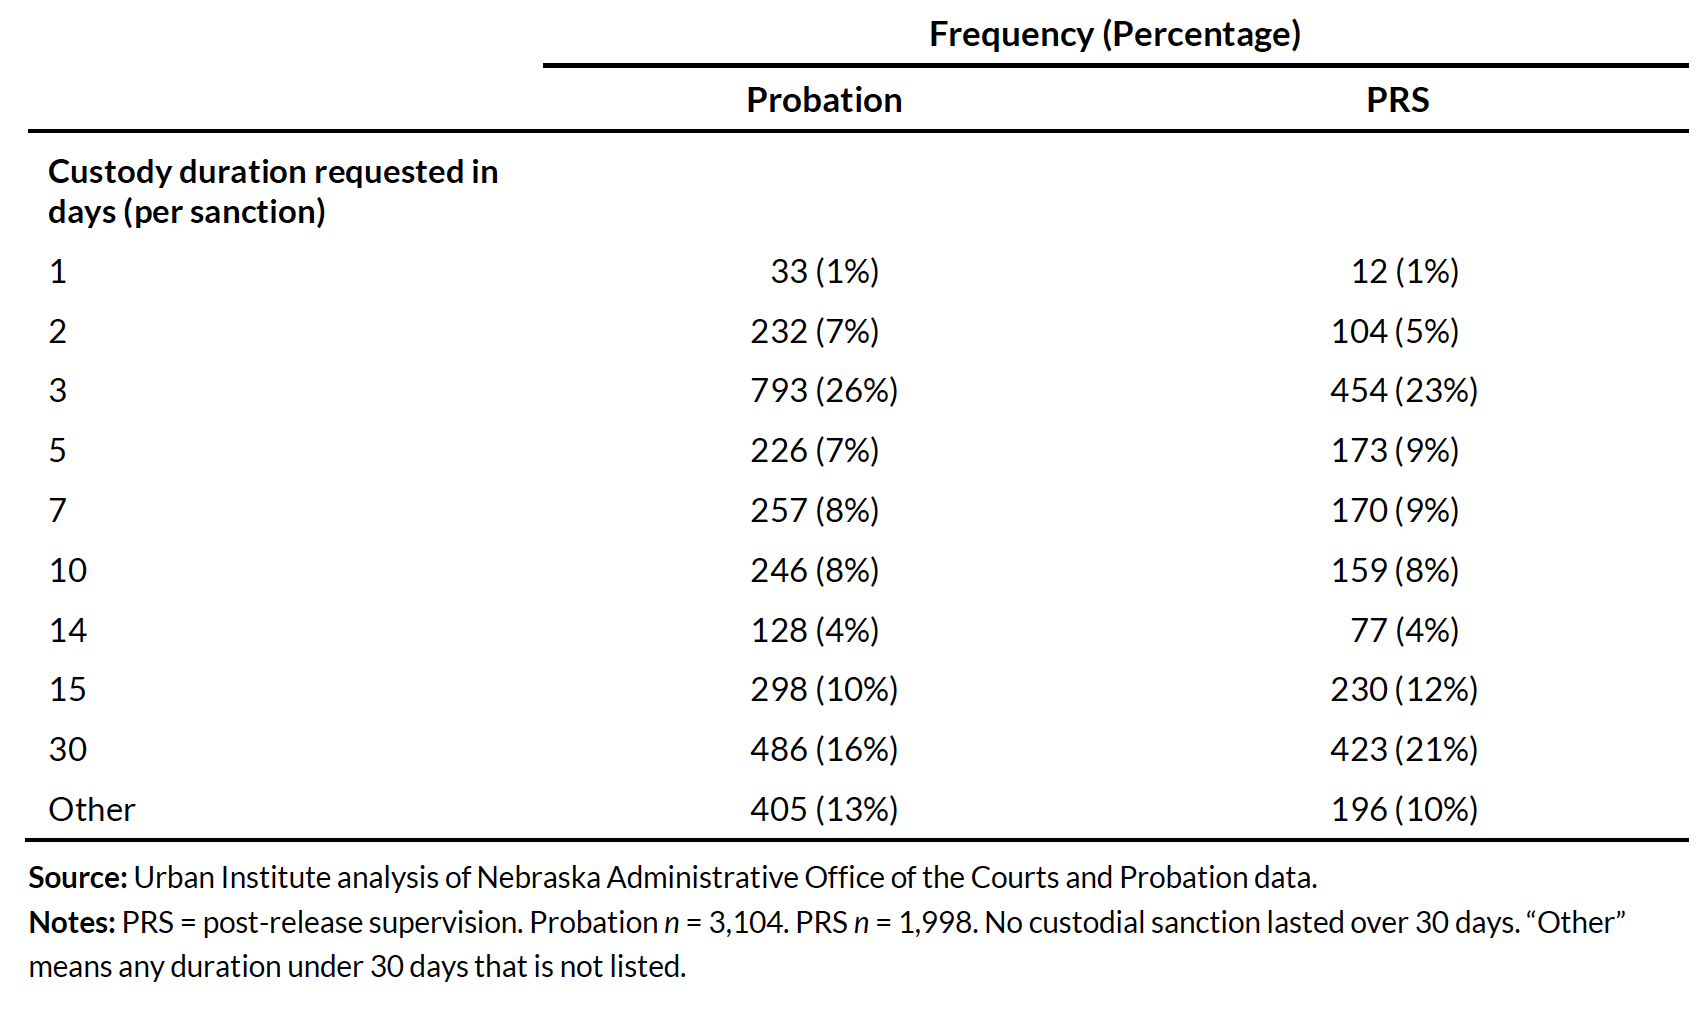
For terms ending in 2019, probation case management terms had an average of 26 days of custodial sanctions served across an average of 2.4 stays, whereas PRS terms had an average of 27 days served across 2.0 stays.
Through the three focus groups we conducted with probation administrators, supervisors, and officers, we learned that as part of implementation, Nebraska leaders provided information and training on the 2015 reform’s key components through live webinars, PowerPoint presentations, and roundtable discussions. The state also tasked committees with writing policies and procedures and learned from trial and error, particularly from judges on how they were interpreting the policy. In addition, an important aspect of implementing the sanctions was establishing and maintaining strong relationships with jails where people on probation or PRS typically serve their sanctions. The training also acknowledged the shifting risk profile of the population, and it trained officers to manage a higher risk caseload.
Custodial Sanctions Are Used for Cases With More Violations and More Serious Violations
We examined whether the serving of custodial sanctions was associated with cases with more violations, more administrative sanctions, and higher likelihood of revocation. Given Nebraska’s supervision policy intends for custodial sanctions to be targeted toward people on supervision who have already received administrative sanctions (in other words, people for whom custodial sanctions would not be the first sanction applied), we would expect that people receiving custodial sanctions would have more violations and more administrative sanctions than those that have not received custodial sanctions. Additionally, as documented above, these custodial sanctions were being applied to a population that, due to the addition of the PRS population as well as changes to the felony probation population, had an increasing proportion of people who started supervision at very high or high risk of recidivating.
As figure 2 shows, among people who started their felony probation or PRS case management terms between 2016 and 2019, 55 percent of those who received custodial sanctions had violations, whereas only 33 percent of people who did not receive custodial sanctions had violations.
Figure 2: Violation Types among People on Felony Probation or PRS in Nebraska Who Did and Did Not Receive Custodial Sanctions, FY 2016–19
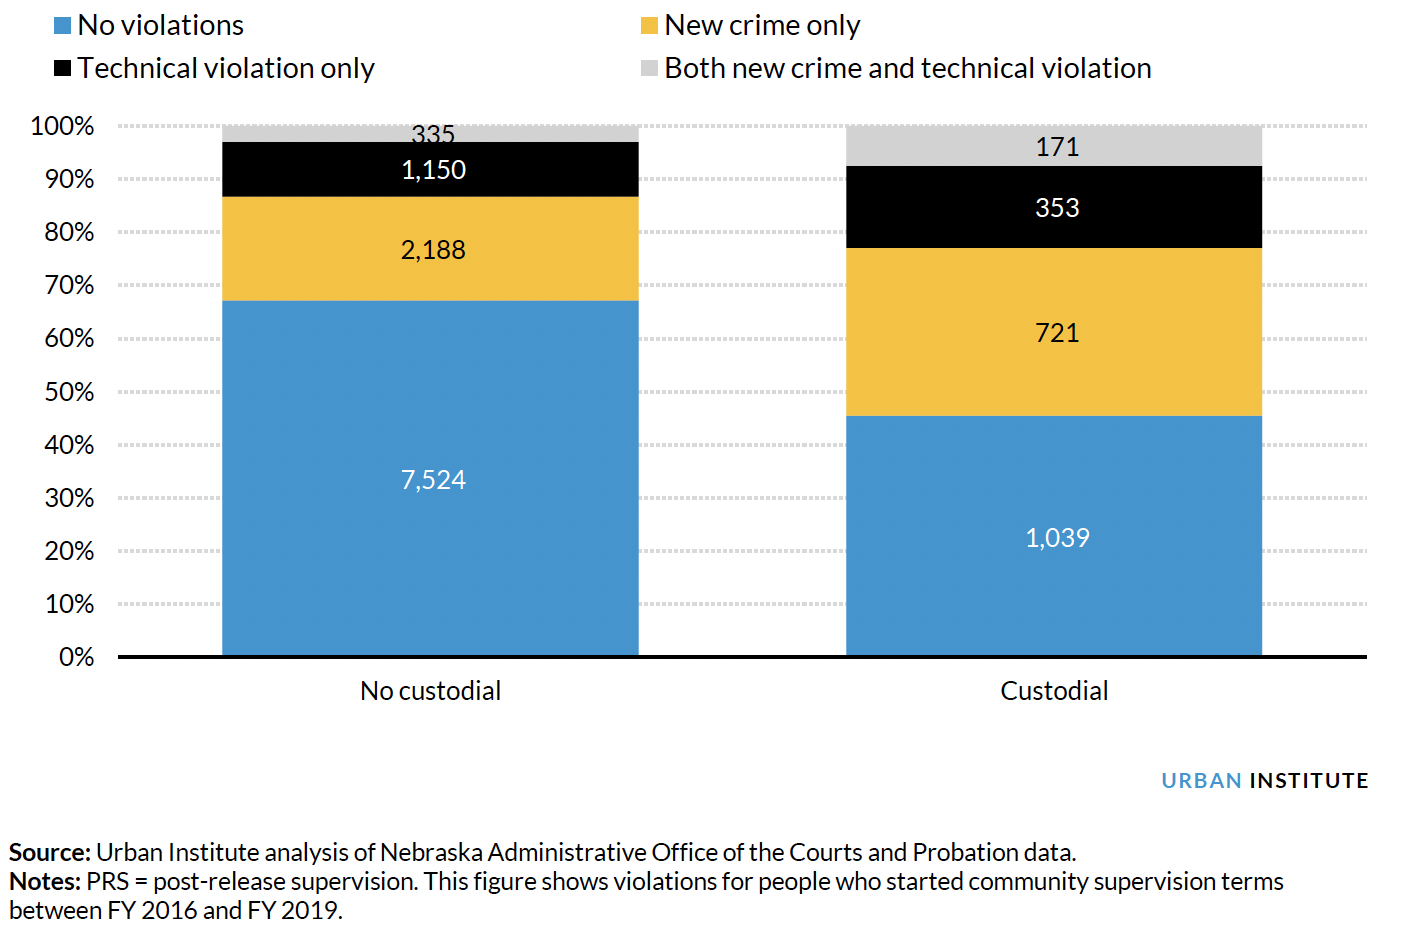
Further, people who had at least one custodial sanction had more violations, and in particular more violations for new crimes, on average, than people who did not. For case management terms that started from 2016 through 2019, people on felony probation or PRS who had a custodial sanction had 1.0 violations on average, whereas people who did not have a custodial sanction had only 0.5 violations on average. The average number of new crime violations was 0.68 for people with custodial sanctions and only 0.35 for people without custodial sanctions.4
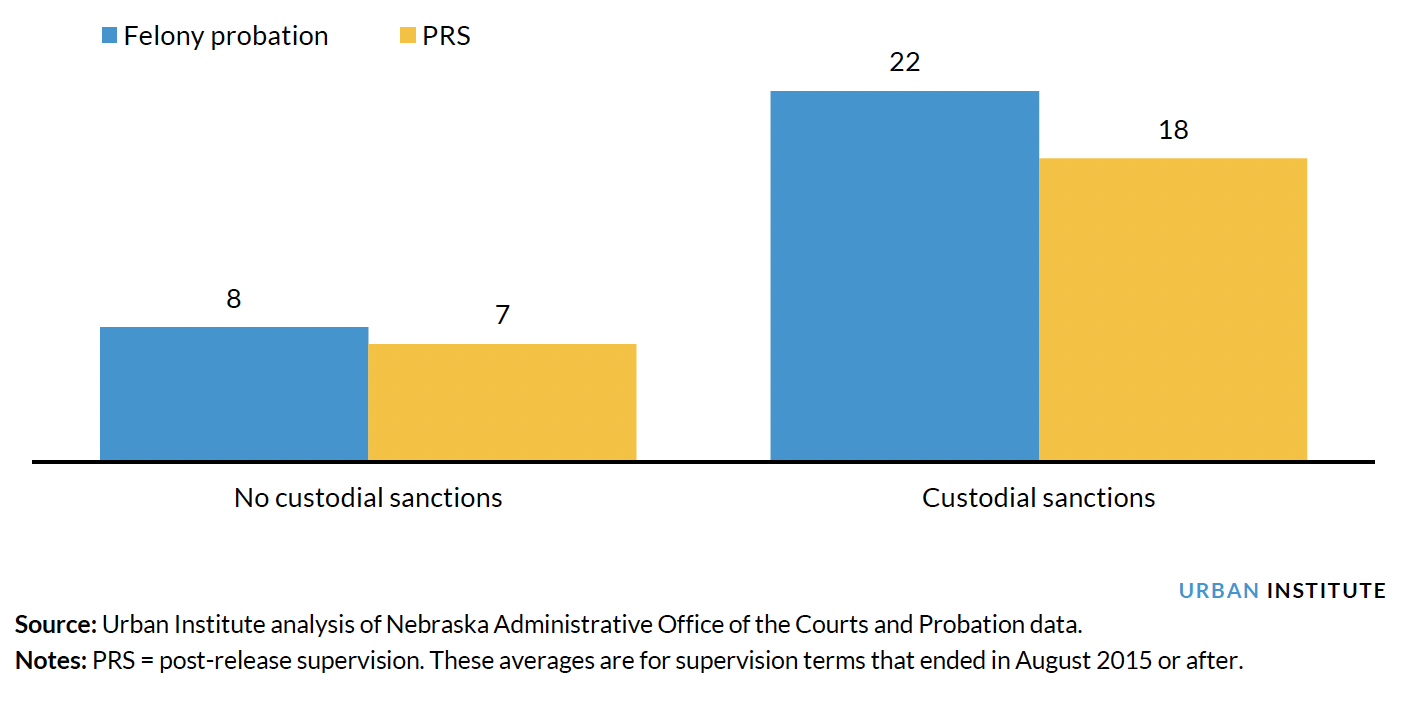
When examining what other responses occurred to address violations, we found that custodial sanctions were associated with more administrative sanctions. As figure 3 shows, for people serving felony probation case management terms that started between August 2015 and the end of 2019, cases that received a custodial sanction had 22 administrative sanctions on average applied, compared with only 8 for cases without custodial sanctions. Similarly, PRS cases that received custodial sanctions had 18 administrative sanctions on average, compared with only 7 administrative sanctions for cases without custodial sanctions.
Figure 3: Average Number of Administrative Sanctions Applied for Felony Probation and PRS Cases That Did and Did Not Have Custodial Sanctions in Nebraska, August 2015 through FY 2019
In 2019, 5 percent of Nebraska’s overall population was Black, compared with 24 percent of people on PRS and 13 percent of people on felony probation. There were no differences in the average number of custodial sanctions by race and ethnicity. For instance, from August 2015 through FY 2019, Black people accounted for 24 percent of all PRS completions (both successful and unsuccessful) and 23 percent of all custodial sanction stays served by people on PRS. Custodial sanctions were also not applied disproportionately for Black people on felony probation, or for Hispanic people on PRS or felony probation.
Incarceration Responses Increased While Revocations Decreased for Felony Probation Cases and Stayed Flat for PRS Cases
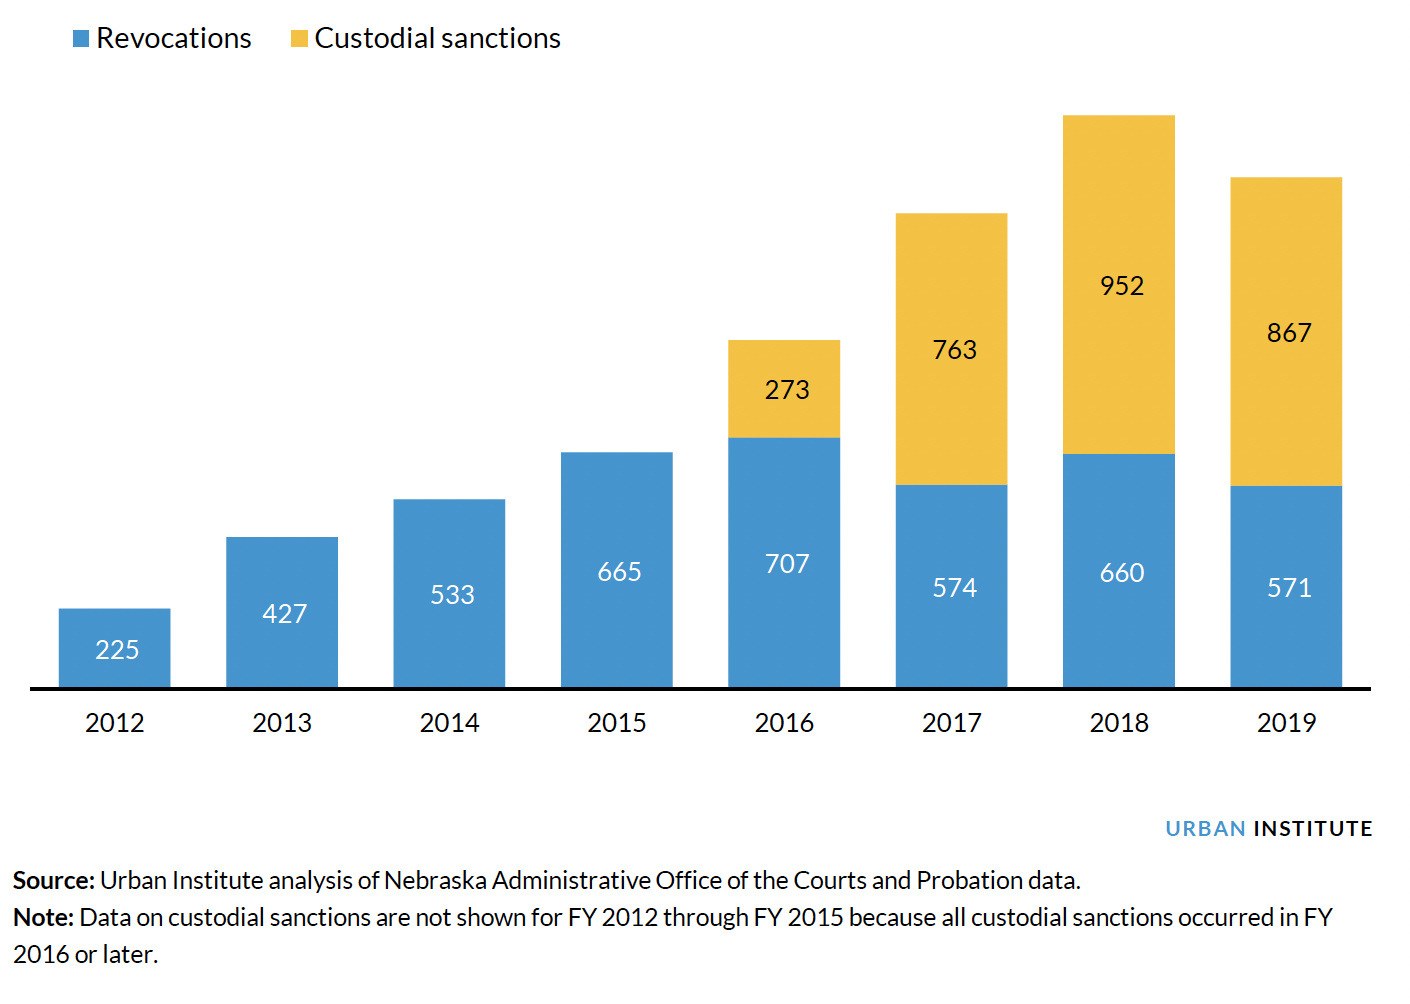
Since custodial sanctions were implemented in Nebraska, overall incarceration responses have increased for the felony probation and PRS populations. As figure 4 shows, for the felony probation population, incarceration responses to violations more than doubled from 2015 through 2019, from 665 to 1,438, but responses that were revocations decreased 14 percent. For the PRS population, violation responses that were revocations or custodial sanctions both increased: 955 violation responses that were revocations occurred in 2019, and 853 violation responses that were custodial sanctions were approved in 2019.
Figure 4: Incarceration Responses to Violations of Felony Probation Terms in Nebraska, FY 2012–19
Lastly, we examined revocation outcomes for people with and without custodial sanctions. Similar to the trend for violations and administrative sanctions, we found that felony probation cases that closed from 2016 to 2019 and received custodial sanctions were more likely to end with a revocation than cases without custodial sanctions. However, of note, a majority of cases that received custodial sanctions still did not end with a revocation. Unsurprisingly, among the felony probation discharges that closed between 2016 and 2019 and had received at least one custodial sanction, 38 percent ended in revocation, compared with only 19 percent of discharges that had not received a custodial sanction. We found a similar trend for the PRS population: among PRS cases that ended between 2016 and 2019 and served at least one custodial sanction, 36 percent ended with a revocation, compared with only 25 percent of cases that had no custodial sanctions.
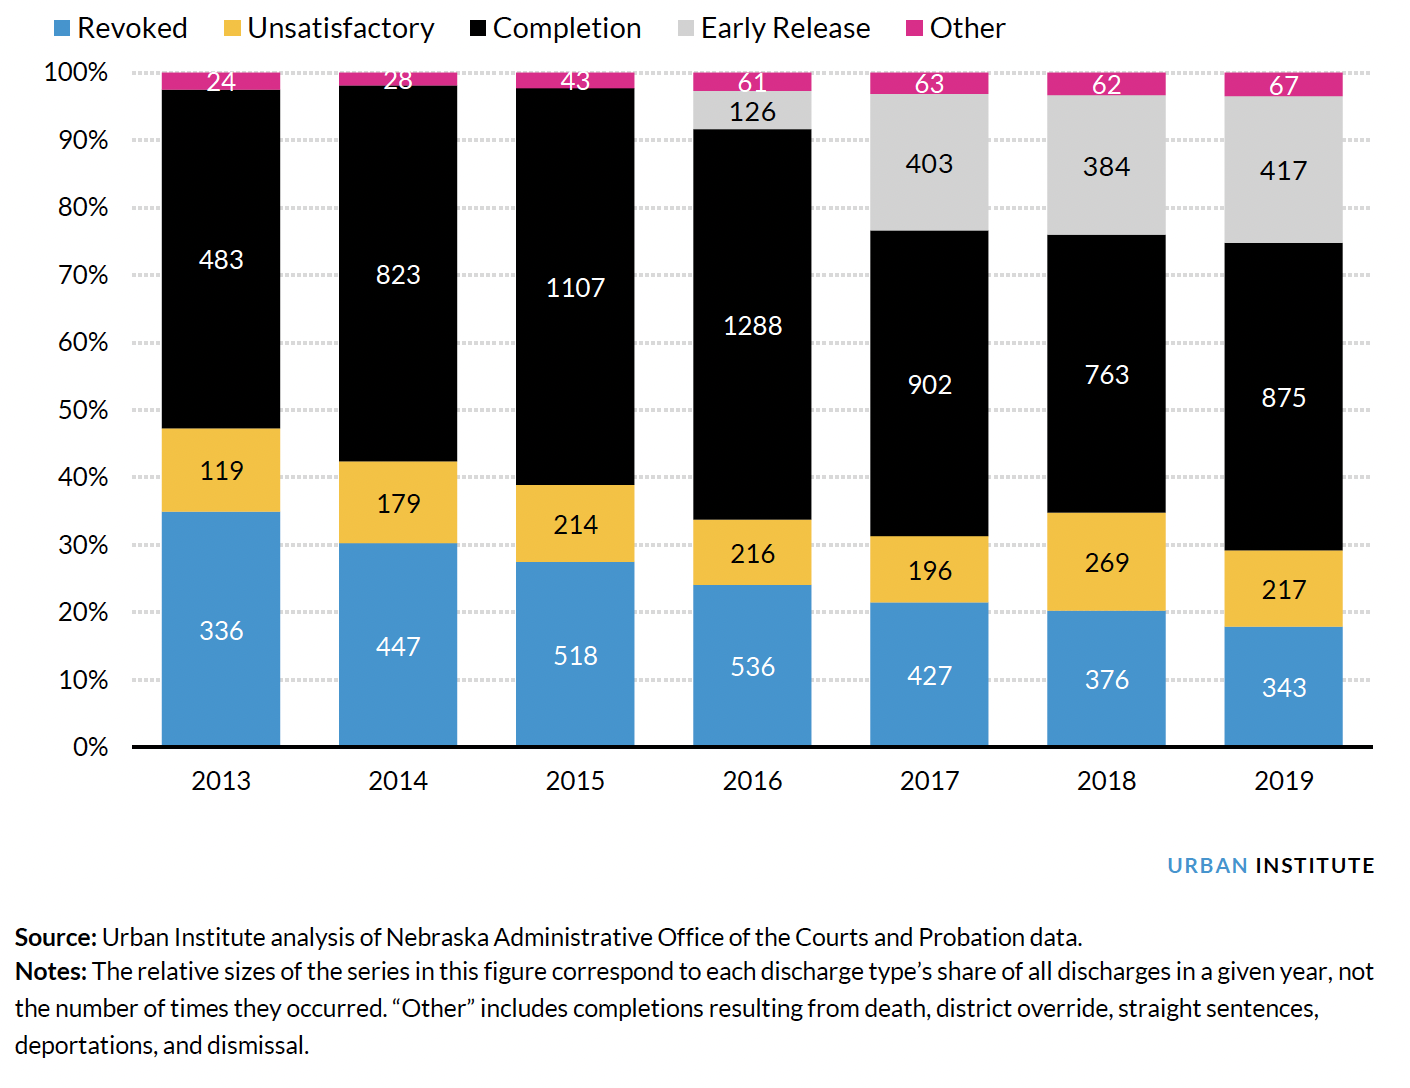
In a period in which the share of people on felony probation considered very high or high risk was rising, a larger share finished successfully than unsuccessfully.5 As figure 5 shows, among all felony probation cases in 2015, 59 percent finished as a completion (one type of successful completion). In 2019, the share completing as early release or completion was 67 percent, which indicates early release was being used more for people on felony probation. Moreover, the share of felony probation cases ending with a revocation decreased from 28 percent in 2015 to 18 percent in 2019. Importantly, and reflecting the trends in incarceration responses shown in figure 4, the number of felony probation terms ending in revocations decreased from 518 in 2015 to 343 in 2019. This decrease in the use of full revocation for the felony probation population connects to the state’s intent to use custodial sanctions to not only improve responses to violations but also reduce the number of people going into prison from felony probation revocations.
Figure 5: Share and Number of Felony Probation Completions by Discharge Type in Nebraska, FY 2013–19
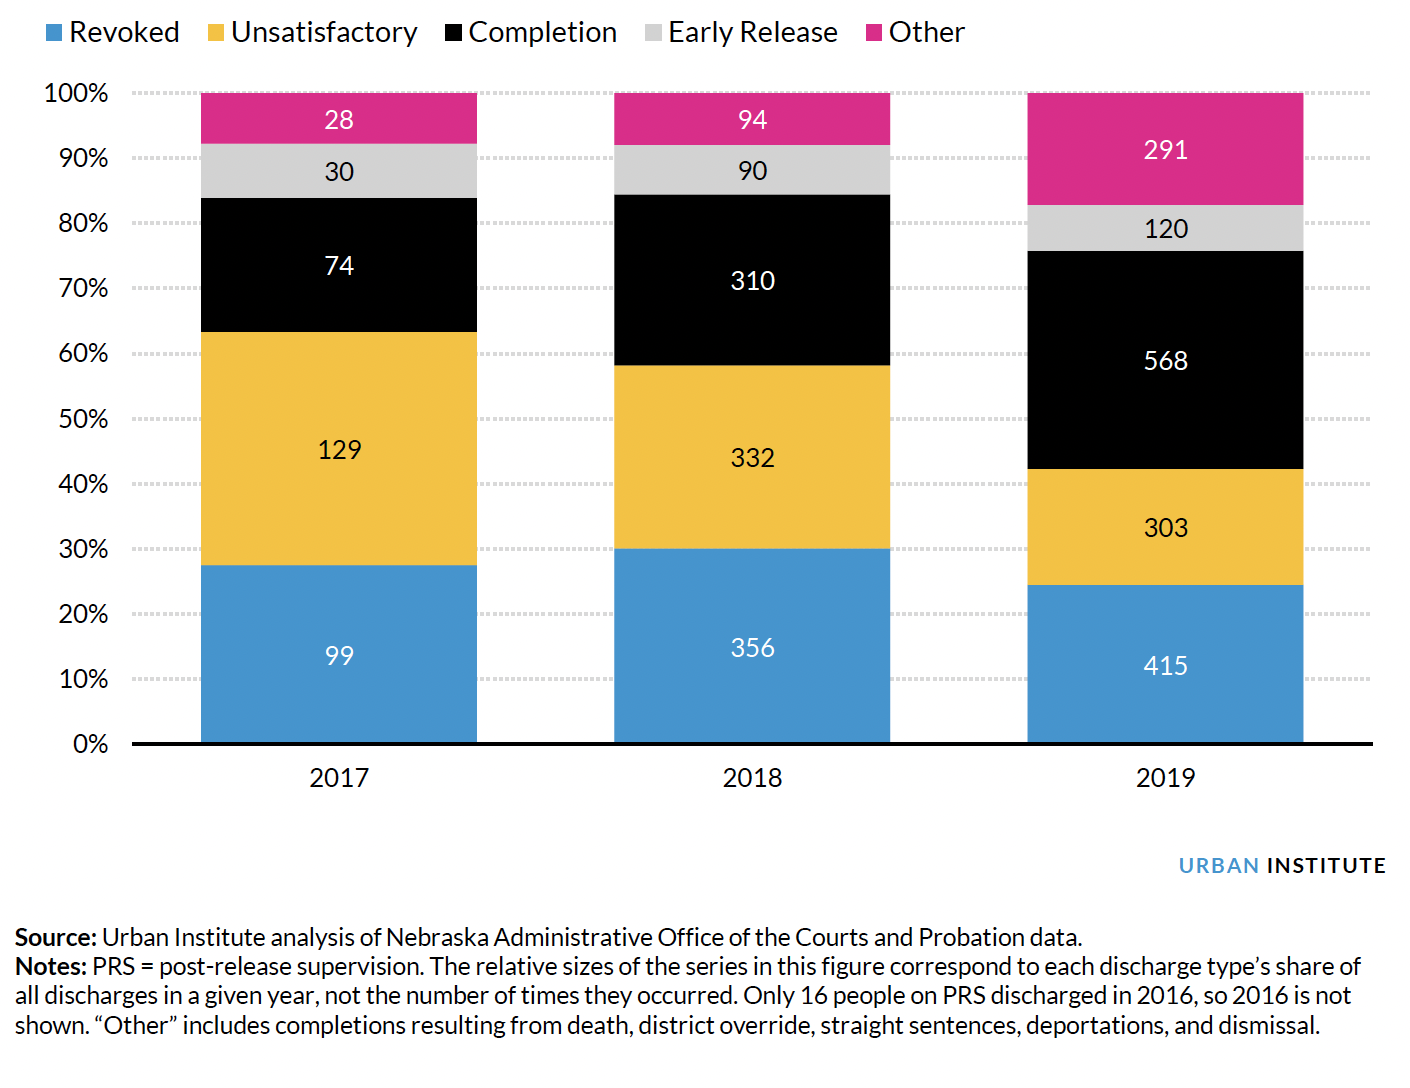
Keeping in mind that the PRS population is almost entirely high or very high risk of recidivating, figure 6 shows a flat trend in revocations from PRS: 25 percent of PRS cases ended with a revocation in 2019, compared with 28 percent in 2017. There were some changes in discharge types for PRS cases from 2017 to 2019, however. In particular, the share completing as “probation completions” increased from 21 percent in 2017 to 34 percent in 2019. In addition, the share finishing unsatisfactorily decreased from 36 to 18 percent.
Figure 6: Share and Number of PRS Completions by Discharge Type in Nebraska, FY 2017–19
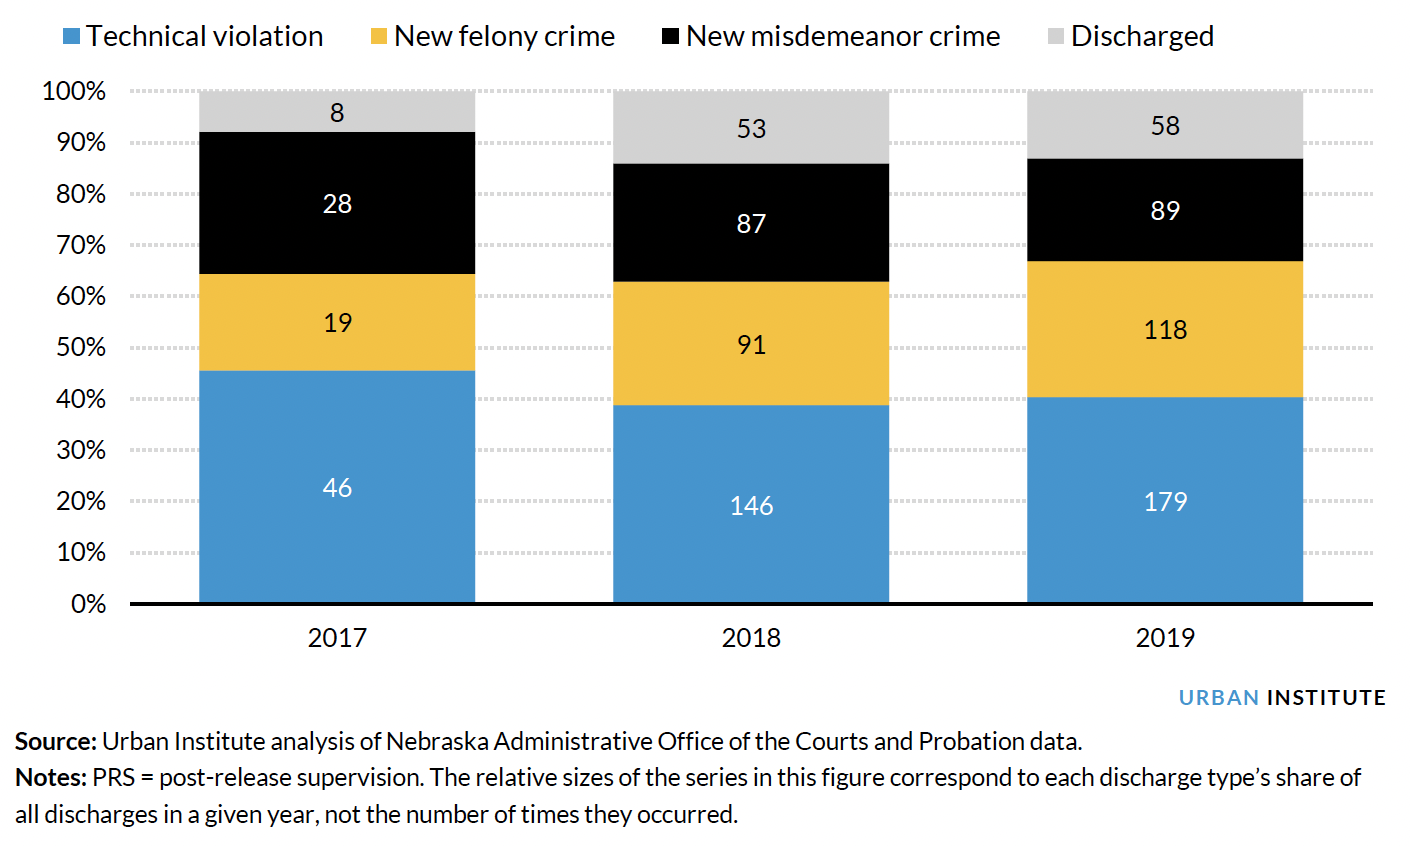
We also examined the reason revocations occurred. Figure 7 shows that for the felony probation population, technical violations accounted for roughly 50 percent of revocations in 2012 and 2013, 43 percent in 2015, and 38 percent in 2019. Figure 8 shows that for the PRS population, technical violations accounted for roughly 40 percent of revocations in 2017 and 2018.
Figure 7: Share and Number of Felony Probation Revocations by Type in Nebraska, FY 2012–19
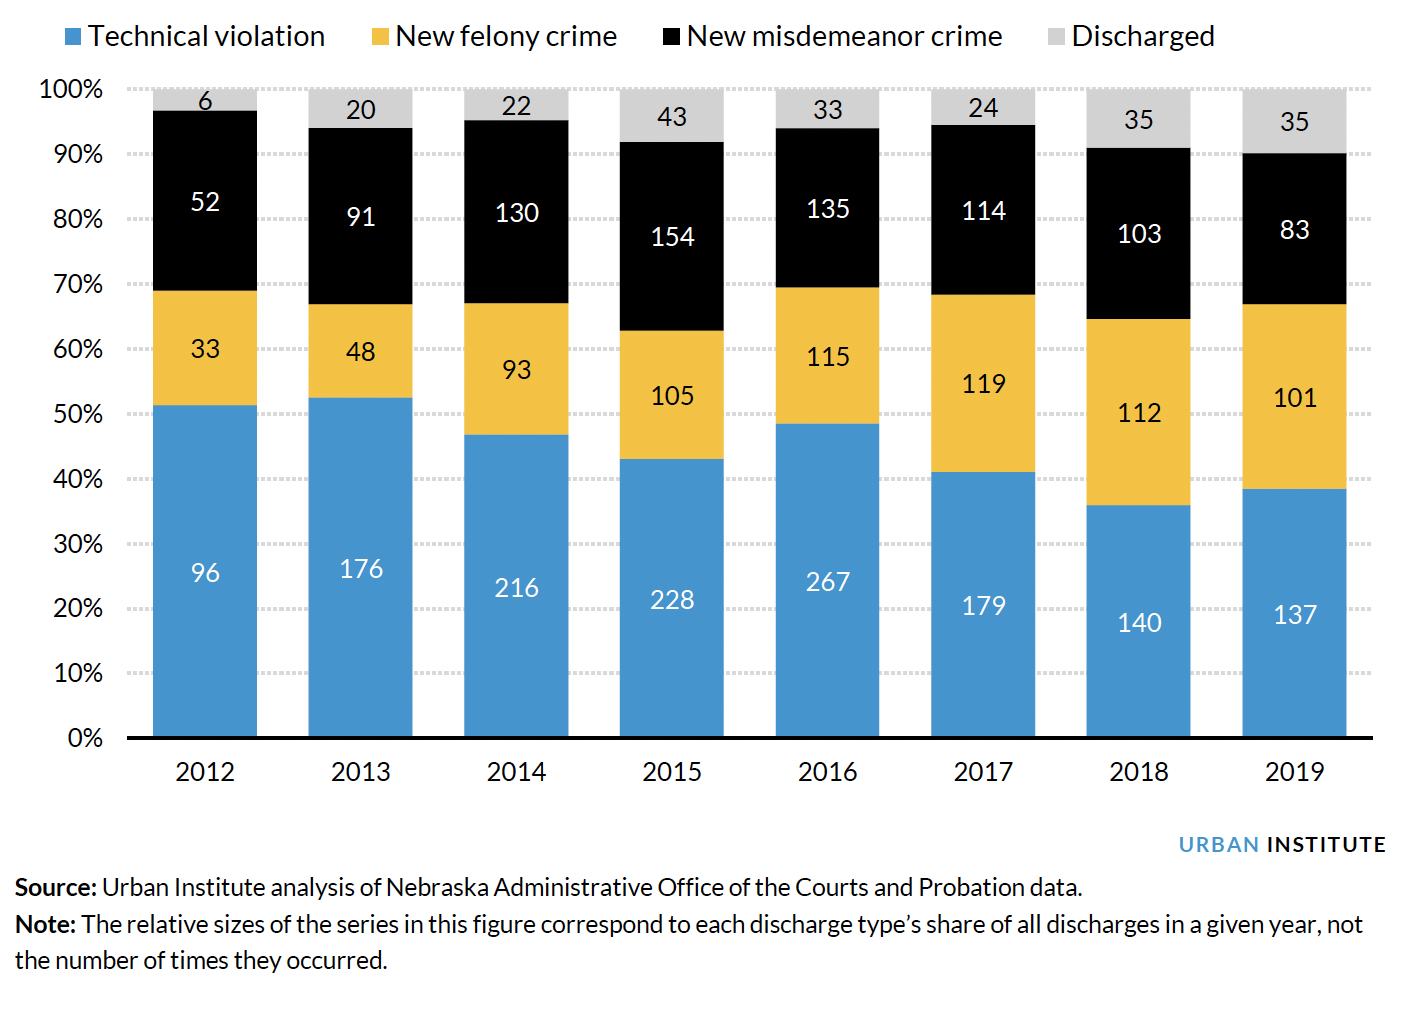
Figure 8: Share and Number of PRS Revocations by Type in Nebraska, FY 2017–19
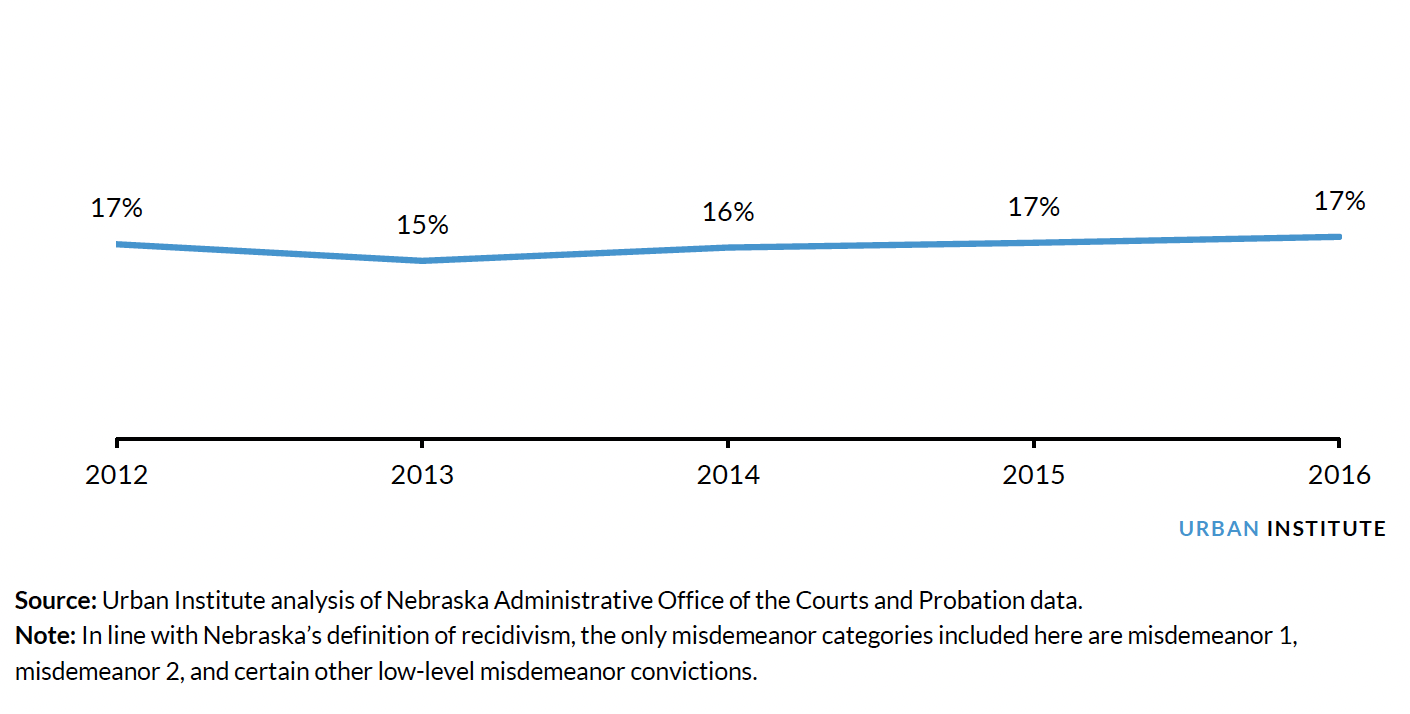
Lastly, there has been little change in reconviction rates over time. The postreform observation period is quite limited. For our purposes, recidivism is measured as a reconviction within three years of successful discharge. Recidivism is not reported for people who were revoked or discharged unsatisfactorily.6 Figure 9 shows that among the felony probation population, the recidivism rate was roughly 17 percent in 2015 and 2016.
Figure 9: Rates of Reconvictions of Felonies or Certain Misdemeanors within Three Years of Successful Felony Probation Completion in Nebraska, FY 2012–16
Revocation Rates Did Not Differ Significantly between Cases That Received Custodial Sanctions and Those That Did Not
When examining the association between the introduction of custodial sanctions and revocation rates and successful completion rates among people on felony probation or PRS, we found no significant difference between cases that did and did not receive custodial sanctions.
To assess the association between custodial sanctions and supervision outcomes, we conducted a propensity score matching analysis with treatment and control groups of 750 people each. First, we limited the overall sample to people who had served a felony supervision term (i.e., probation or PRS), had at least one violation in their case management term (i.e., a new-crime violation and/or technical violation), and who had completed supervision between 2016 and 2019 or later. Next, out of this limited sample, cases that had at least one custodial sanction stay during the case management term were in the treatment group and, based on a wide range of characteristics, we developed a matched control group of people who had no custodial sanctions. We found that people with custodial sanction stays are no more likely or unlikely to successfully complete supervision or be revoked.7
Further, the qualitative information collected during interviews indicates that staff perceptions of custodial sanctions are mostly neutral. Staff consider them an additional tool for supervising people on felony probation and PRS. The approval process for custodial sanctions is lengthy, making them more difficult to use to respond quickly to the behavior of people on supervision. Staff also noted that, used in isolation without other intervention responses that address the underlying causes of behavior associated with violations, custodial sanctions do not result in significant behavior change.
Utah
In 2014, in response to a growing prison population and in an effort to improve community supervision outcomes, Utah passed H.B. 348, comprehensive legislation that reformed many aspects of the justice system. To change supervision outcomes, Utah altered its approach to responding to supervision violations by developing the Response and Incentive Matrix (RIM) for people on probation and parole. The RIM provides supervision officers a structured decisionmaking framework with a continuum of graduated responses for incentivizing positive actions and compliance and discouraging violations. One response to violations is an incarceration stay, which can be between 0 and 180 days.
Using data from the Utah Department of Corrections (UDC) Adult Probation and Parole, we examined the impact of the RIM’s implementation, focusing on the implementation of time-capped incarceration stays used in response to supervision violations and the impact of this response on revocations and successful completions for people supervised on probation and parole. We found the following:
- Prereform, responses to violations were less structured; H.B. 348 made responses more structured and implemented graduated incarceration caps and RIM jail days, specifying the number of days of incarceration for particular types of violations.
- Incentives increased each year postreform, especially the most significant types of incentives, such as early termination.
- Postreform, incarceration responses were used for cases with more serious violations.
- Rates of successful completions and recidivism (defined as felony convictions leading to referral to the Utah Department of Corrections after discharge from supervision) remained steady postreform for the entire supervision population.
- Cases with incarceration sanctions were associated with higher one-year recidivism rates than those without incarceration sanctions.
Background on Supervision Responses in Utah
In 2012, Utah’s prison population had grown 18 percent since 2002 and was expected to grow by more than one-third by 2034. Data analysis found that supervision failures and long prison stays were key issues the state could address. People on probation and parole were increasingly failing on supervision, and two-thirds of prison admissions in 2013 owed to people having their supervision revoked. Forty-three percent of those revocations owed to technical violations (CCJJ 2014).
To act on these findings, Utah launched a Justice Reinvestment Initiative effort, and in 2015 passed and implemented H.B. 348 (box 2 describes trends in the probation and parole populations the state saw after it passed this legislation). Its changes included the implementation of a graduated response matrix for probation and parole, including short jail stays as a response to supervision violations. It also established earned compliance credits and formal graduated revocation caps for technical violations of probation and parole, revised the sentencing guidelines for certain lower-level crimes, and expanded treatment services and treatment standards and certifications.
The RIM provides a structure for both incentives and responses to violations, including time-limited incarceration stays. Some incentives and responses can be delivered by community supervision officers, some require approval by a supervisor, and some require approval from a supervisor and the court and/or the Utah Board of Pardons and Parole. Table 2 outlines the components of this approach.
Table 2: Types of Responses Included in Utah’s Response and Incentive Matrix
Using data from the UDC, we examined the use of RIM jail days and graduated incarceration caps for violations of supervision. We also completed qualitative interviews with 13 probation and parole agents, supervisors, and administrators, as well as 6 judges from across the state. The qualitative and quantitative data allowed us to examine the following research questions:
- How has the response to violations been implemented as part of a broader supervision reform effort?
- How have metrics such as supervision violations, revocations, successful completions, and recidivism changed since RIM responses to violations were implemented?
- What has been the policy’s impact on supervision outcomes?
Our analysis has two primary data limitations. First, we had very limited ability to pull data on incarceration stays during supervision terms, meaning we could not measure the cumulative number of days people spent incarcerated for jail sanctions and graduated revocation caps by case. Second, we could not conduct interviews with all stakeholders of interest, including members of the Board of Pardons and Parole as well as people who are serving supervision terms or who have served terms since the policy change.
Box 2
Population Trends in Utah
As Utah implemented graduated responses to supervision violations, its probation and parole populations changed. Probation and parole starts increased 24 percent from 2015 to 2019 (the larger increase occurred among the parole population). Felony probation starts decreased 7 percent while misdemeanor A starts increased more than 50 percent. These were expected shifts, as the overall sentencing changes made in H.B. 348 modified incarceration sentences and eligibility for supervision among people on probation and parole.a Time served on supervision remained relatively steady from 2015 to 2019 for probation cases; for parole cases, people who successfully completed spent more time on supervision from 2015 to 2019, while people who ended parole unsuccessfully spent less. The risk profile of the population also shifted during this period: the share of cases starting on parole classified as high- or intensive-risk was 67 percent in 2015 and rose to 76 percent in 2019; among people on probation, this share rose from 57 percent in 2015 to 62 percent in 2019. The felony probation and parole populations did differ on some key characteristics.b
Source: Urban Institute analysis of data from the Utah Department of Corrections Adult Probation and Parole division.
Notes
a For example, Utah changed the sentencing structure for first and second offenses of drug possession, moving those offenses to misdemeanors and removing them as felonies. See Elderbroom, Sakala, and Khalid (2020).
b In 2019, 74 percent of people on probation had property offenses, “other” offenses, or drug/alcohol offenses as their primary offenses, whereas 61 percent of people on parole had these as their primary offenses. Moreover, 44 percent of people on probation were supervised in Region 3 (the Salt Lake City County region), compared with 56 percent of people on parole.
Findings on Incarceration Sanctions in Utah
Responses to Violations Shifted after Reform
In 2015, roughly 24,800 violations were reported across Utah’s probation and parole populations. By 2019, roughly 38,900 violations were reported, an increase of more than 50 percent (the state’s supervision population only increased 24 percent during that period). The ratio of technical violations to new crime violations remained steady, with technical violations representing roughly 80 percent of all violations. Since the increase in violations did not change the ratio of technical violations to new crime violations, more investigation into what is driving this increase would be useful. For example, an examination of violations by risk level is recommended, as the proportion of high- and intensive-risk cases increased during this period.
In 2015, Utah implemented new responses to violations of community supervision. Before implementation, responses lacked statewide consistency and could involve incarceration time, other responses used to sanction violations, or full revocation to prison. After implementation, those three types of responses were still available but were more structured and came with guidance on what responses were appropriate given the nature of a violation (full revocation remained an option for new crimes and threats to public safety). Moreover, three levels of violation types, 1 being the least severe and 3 being the most severe, were established and had corresponding guidance on response types. For level 1 violations, the responses include verbal warnings and increased drug testing and supervision. For level 2 violations, responses include treatment center referrals, community service, and curfews. For level 3 violations, responses include RIM jail days and graduated incarceration caps. Participants in the focus groups indicated they were provided extensive training on how to use and implement the new structured response system with people on their caseloads.
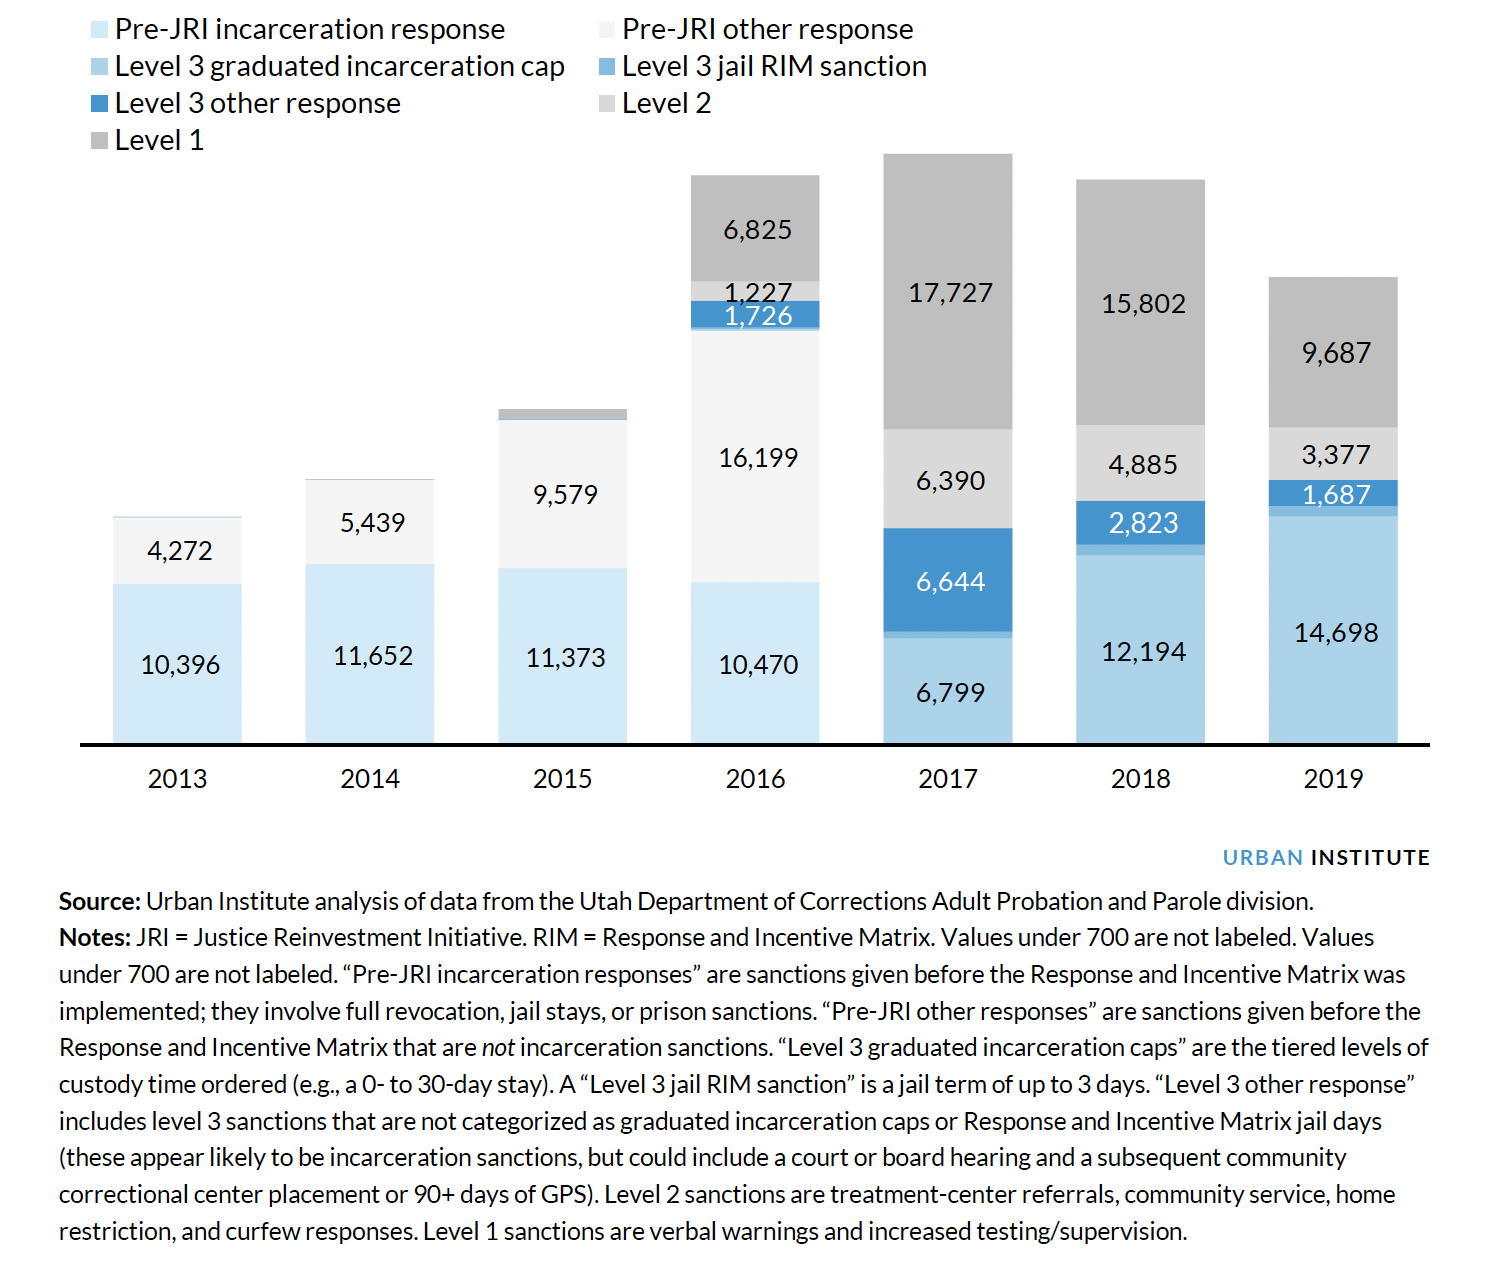
These new responses started to be used in 2016. Figures 10 and 11 show that the number of incarceration responses (shown in shades of blue)8 to parole and probation violations increased each year, including after the introduction of the new types of responses. Figure 10 shows that incarceration responses to parole violations gradually became the largest category of responses by 2019. Figure 11 shows that among probation cases, incarceration responses increased to more than 17,000 in 2019.
Figure 10: Types of Responses to Parole Violations in Utah, 2013–19
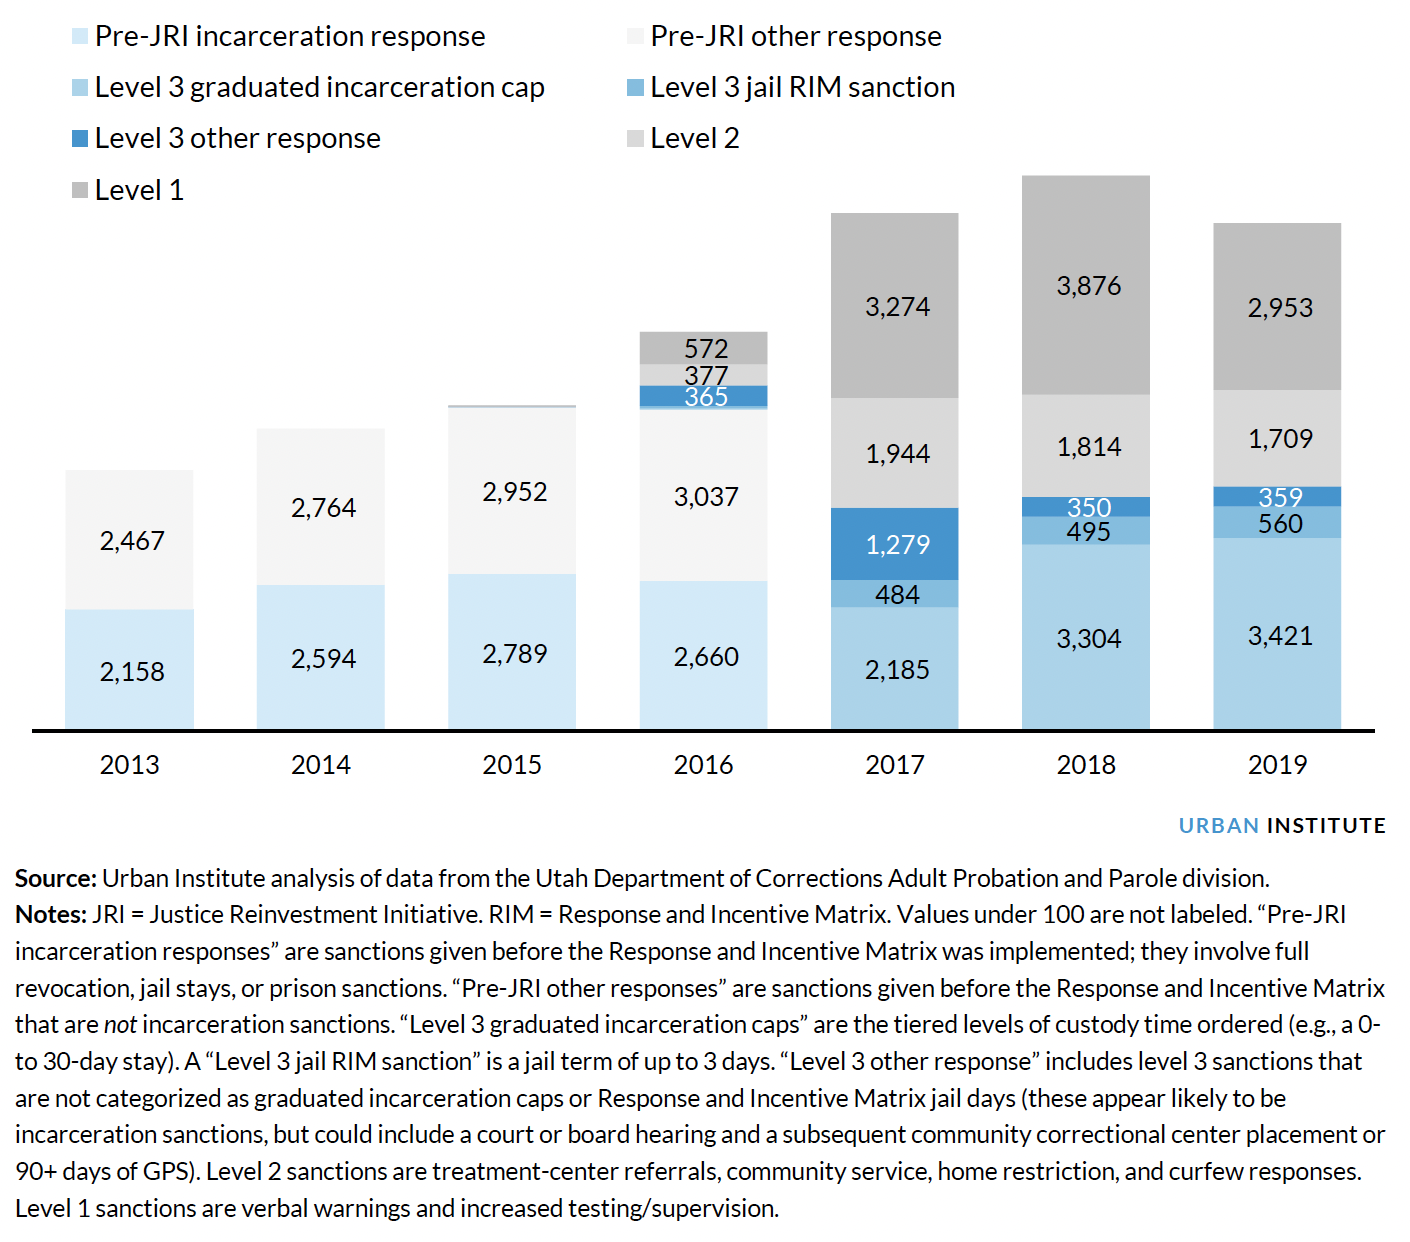
Figure 11: Types of Responses to Probation Violations in Utah, 2013–19
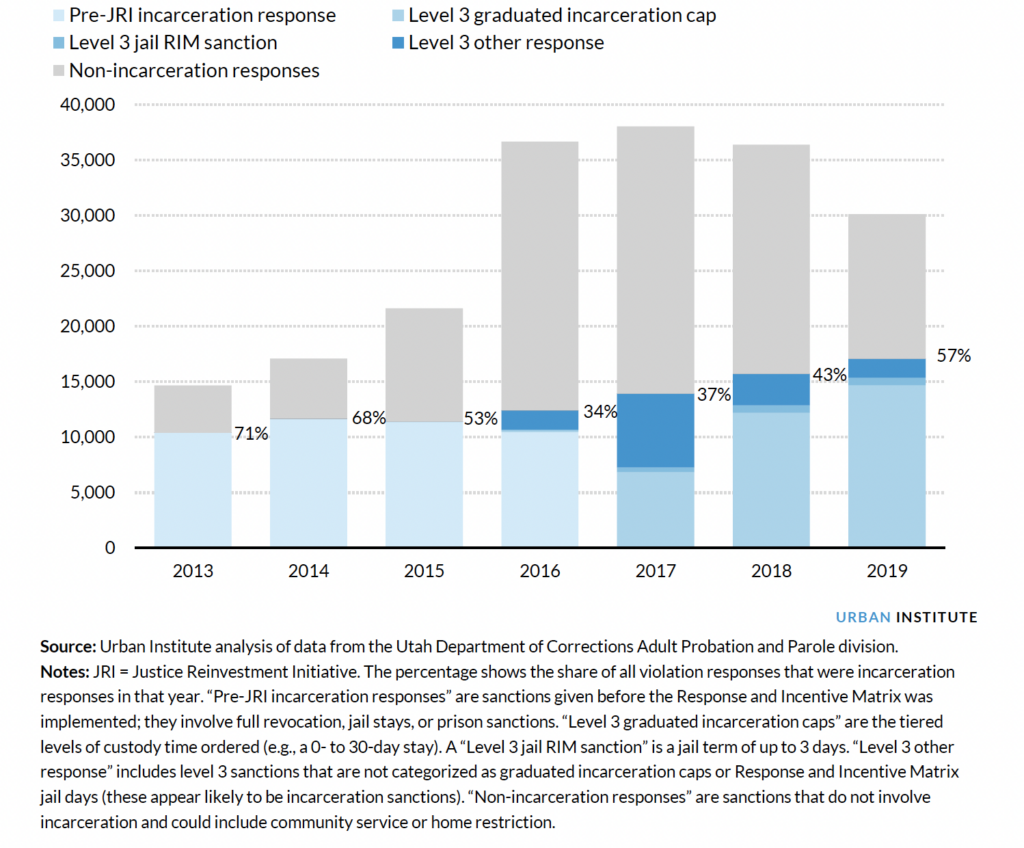
While incarceration stays among the probation and parole populations increased more than 50 percent from 2015 to 2019, the number of incarceration responses as a proportion to total violations remained steady. As figure 12 shows, for parole, the proportion of all parole violation responses that were incarceration-based responses was 48 percent in 2015 and 2019, with incarceration stays matching the increase in overall violations reported. As figure 13 shows, for probation, the proportion of probation violation responses that were incarceration-based responses varied during the implementation period, decreasing immediately after reform from 53 to 34 percent before increasing almost to 2015 levels (57 percent) by 2019.
Figure 12: Parole Incarceration Responses as a Proportion of Total Parole Violation Responses in Utah, 2013–19
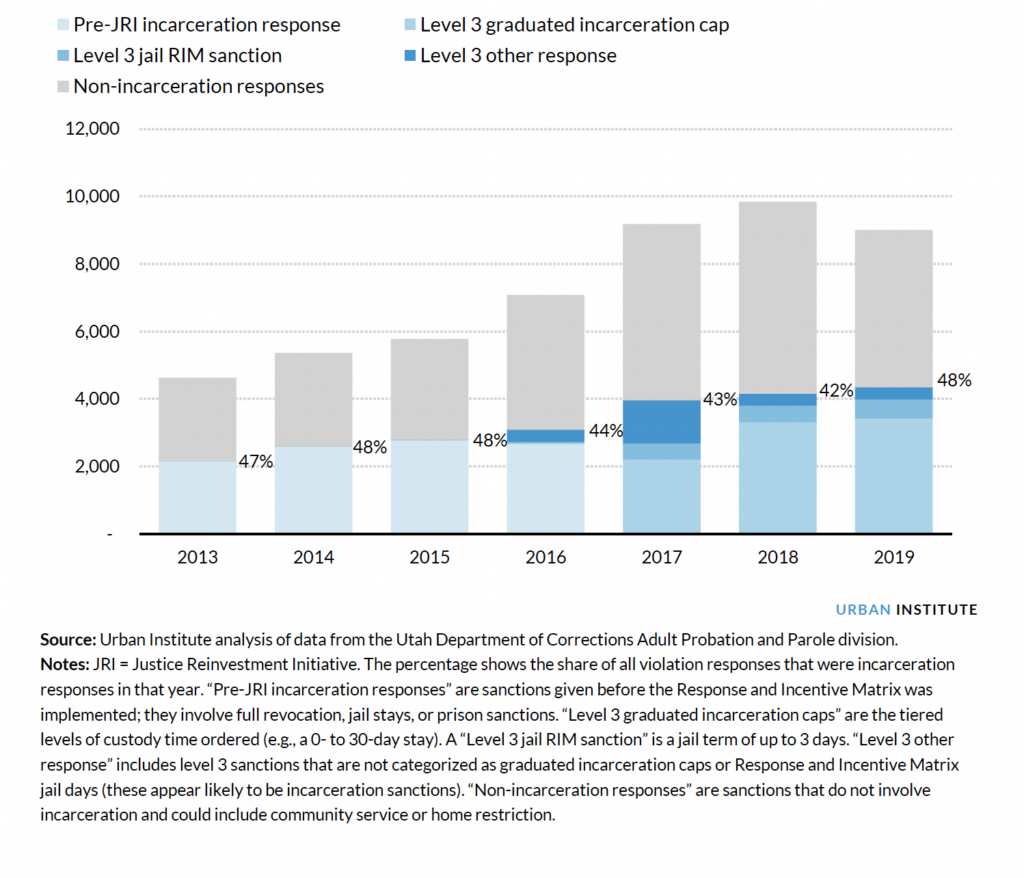
Figure 13: Probation Incarceration Responses as a Proportion of Total Probation Violation Responses by Year in Utah, 2013–19
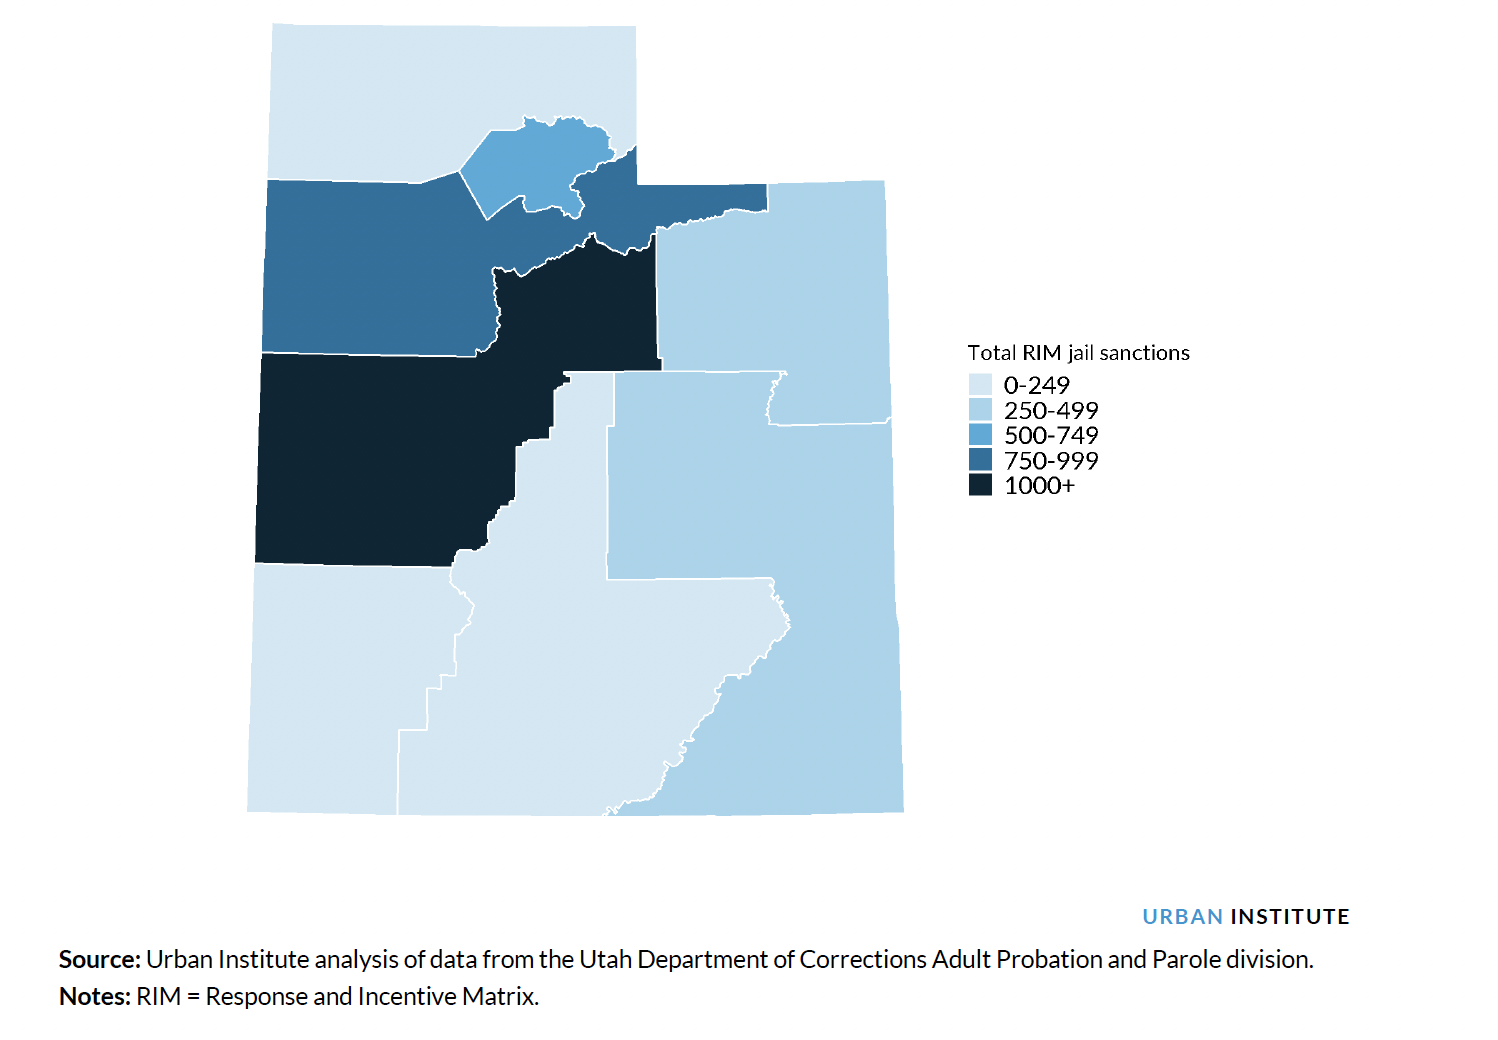
Notably, the number of responses entailing RIM jail days remained at roughly 500 a year for parole violations and under 700 for probation violations from 2017 through 2019; RIM jail days accounted for less than one-tenth of all violation responses for both supervision types postreform. Judges we interviewed reported that the technology and process for approving or denying RIM jail days is relatively easy to use, and probation and parole officers reported during focus groups that they sometimes wait before requesting a longer incarceration response (i.e., a graduated revocation cap). Figure 14 shows that between October 2015 and December 2019, the use of RIM jail days varied by judicial district. More than 1,000 RIM jail sanctions were given in District 4 (Juab, Millard, Utah, and Wasatch Counties), and fewer were given in the more-populous District 3 (Salt Lake, Summit, and Tooele Counties).
Figure 14: Total RIM Jail Sanctions by Utah Judicial District, October 2015 through December 2019
Incentives Increased Each Year after Reform, Especially the Most Significant Types
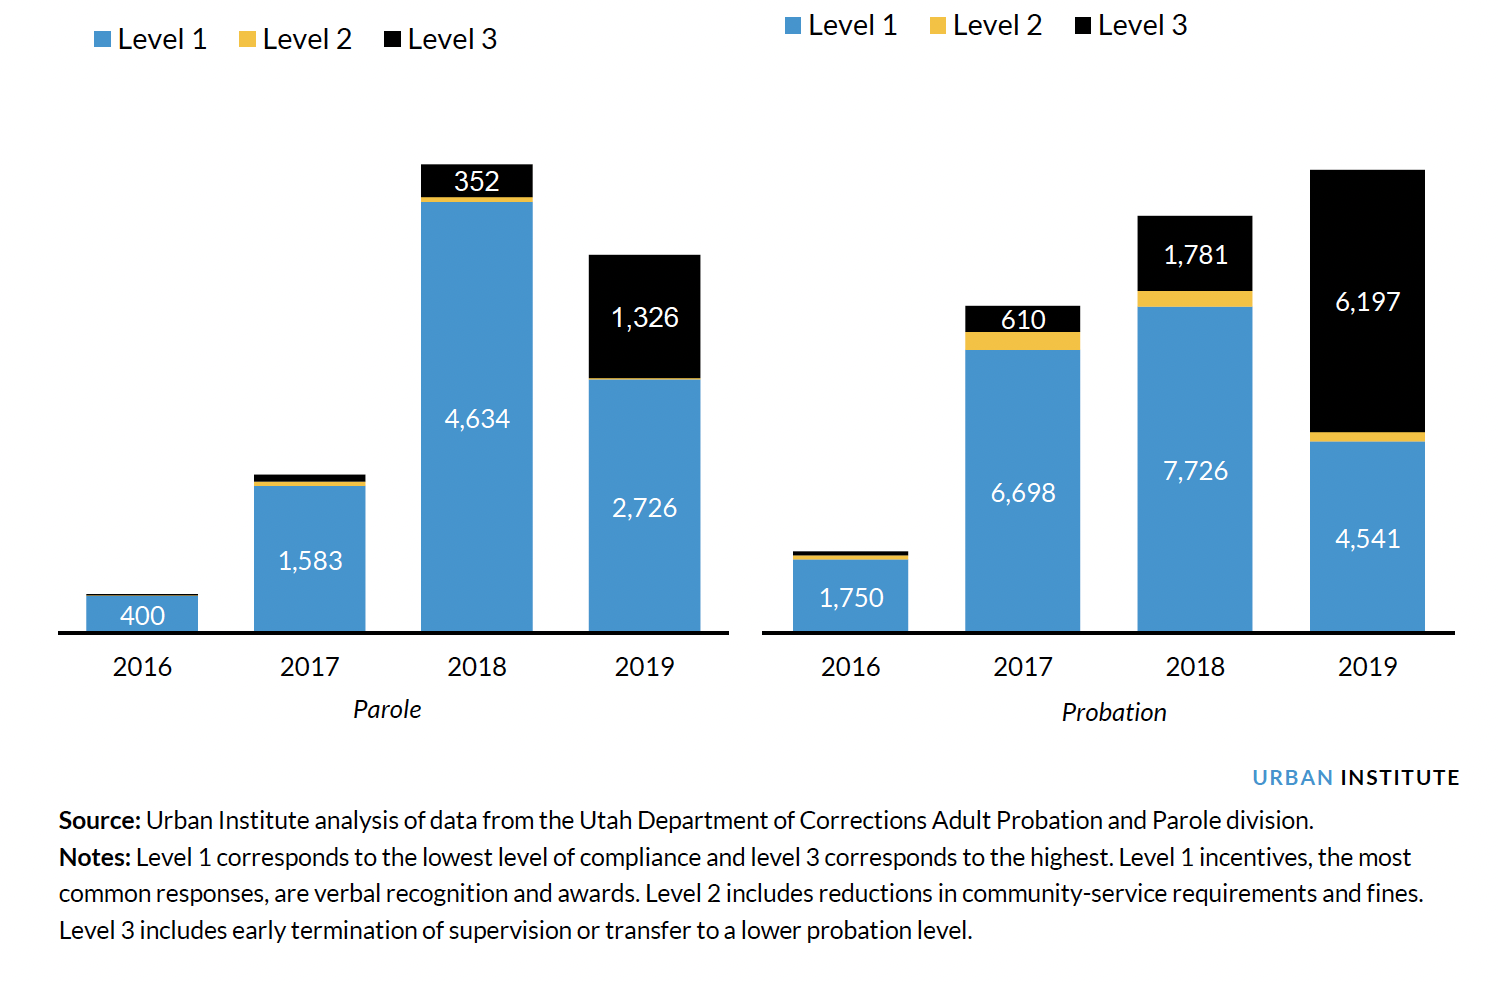
As part of its new approach to responding to supervision violations, Utah introduced three levels of incentives. Similar to the levels established for responding to violations, level 1 corresponds to the smallest level of incentives and level 3 corresponds to the biggest, each with different suggested responses. For level 1 incentives, the most common responses are verbal recognition and awards. Level 2 includes reductions in community service requirements and fines. Level 3 includes early termination of supervision or transfer to a lower probation level. Although Utah’s data system does allow for the recording and reporting of incentives, stakeholder interviews revealed it is likely that not all incentives are being entered into the data system. Nonetheless, the data show that the use of incentives increased rapidly after implementation; among the parole population, level 1 incentives were used the most, and level 3 incentives increased to more than 1,300 in 2019 (figure 15). Moreover, among the probation population, total incentives earned increased each year through 2019; in 2019, level 3 incentives were the majority of all incentives given (figure 15).
Figure 15: Incentives Given to People on Parole (Left) and Probation (Right) a Year in Utah by Incentive Level, 2016–19
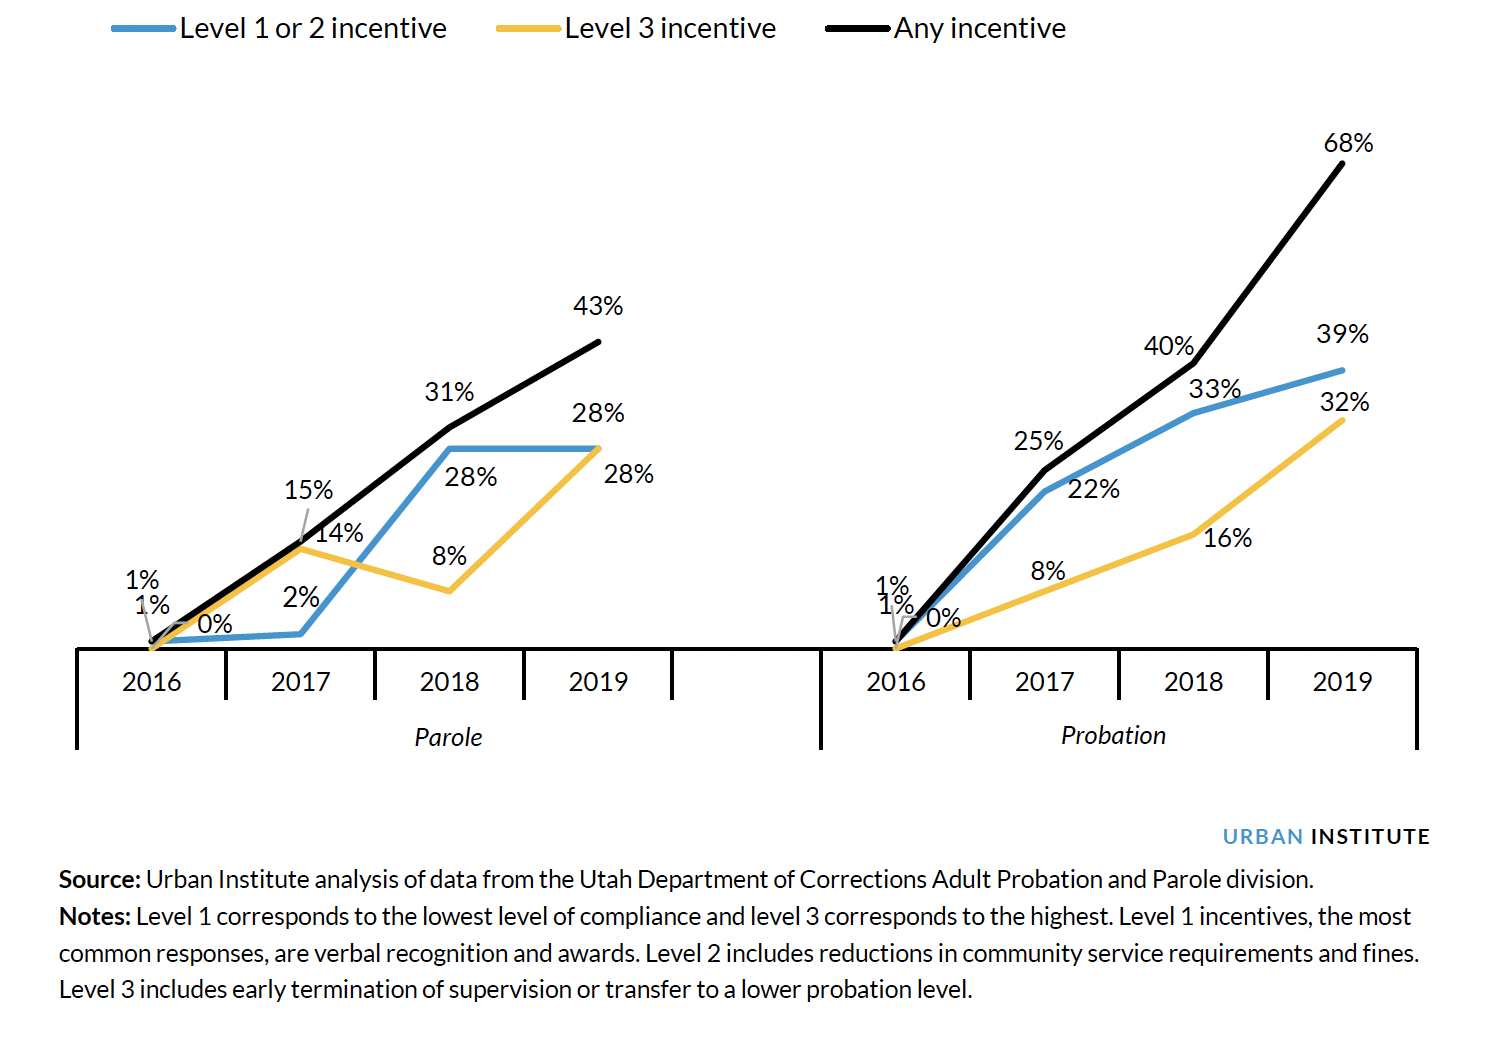
Moreover, the shares of people on probation and parole who received incentives increased from 2016 through 2019. In 2019, 43 percent of parole cases and 68 percent of probation cases that ended had received an incentive at some point (figure 16).
Figure 16: Share of Parole Terms (Left) and Probation Terms (Right) That Had Received Incentives by End of Year, 2016–19
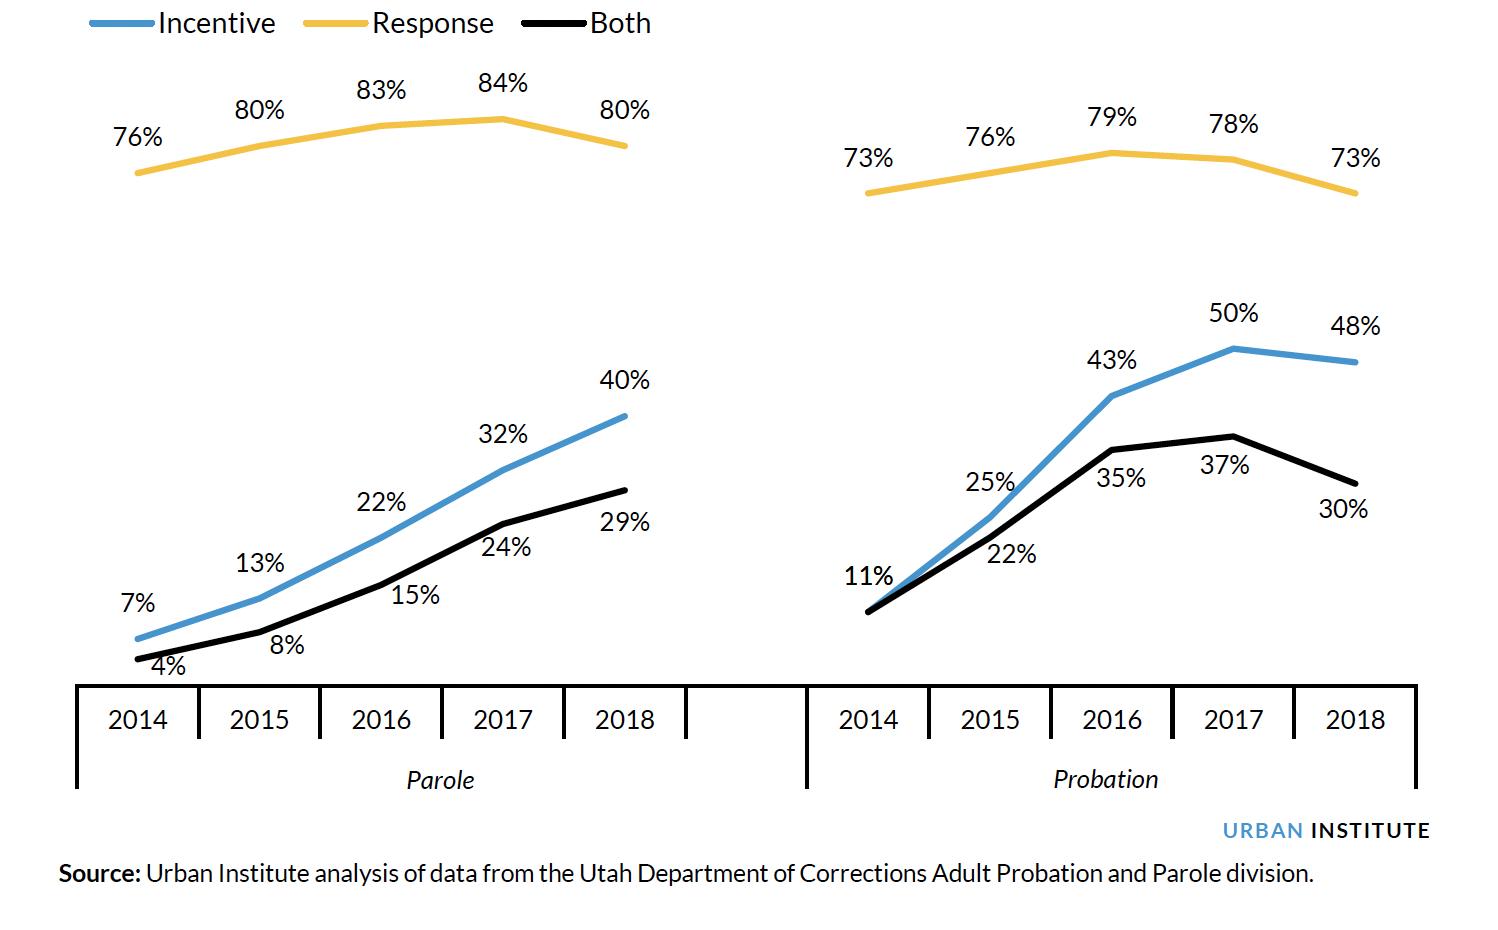
Lastly, when examining the introduction and use of violation responses and incentives, the analysis shows the steady use of violation responses and a steady increase in the use of incentives. Figure 17 shows that although parole and probation terms both had a higher proportion of responses to violations, the share of parole terms that received an incentive reached 40 percent by 2018 while the proportion of such probation terms was close to half by 2017.
Figure 17: Share of Probation and Parole Terms Receiving an Incentive, Response, or Both by Start of Year, 2014–18
In 2019, 1.5 percent of Utah’s population was Black and about the same percentage was Native American/Alaska Native,9 whereas 5 percent of the people on supervision were Black and 4 percent were Native American/Alaska Native. Notably, our analysis found that among Utah’s community supervision population, incentives and incarceration responses to supervision violations were applied at similar rates by race and ethnicity. Postreform, Black people accounted for 6 percent of all parole discharges and accounted for similar shares of total incentives given to people on parole (5 percent of level 1 and level 2 incentives and 4 percent of level 3 incentives) and of total incarceration responses issued for people on parole (6 percent of RIM jail days and 7 percent of graduated incarceration caps). Postreform, Black people also accounted for a similar share of all probation discharges (5 percent) and of total incentives (4 percent) and incarceration responses (3 to 6 percent). Similarly, among Hispanic and Native American/Alaska Native people, the shares of people discharging from probation or parole were roughly equivalent to the shares receiving incentives or incarceration responses.
Incarceration Responses Are Used for Cases with More Serious Violations
A graduated approach is used in the application of responses and incentives in Utah. This means that less serious violations receive lower-level responses while more serious violations receive higher-level responses.
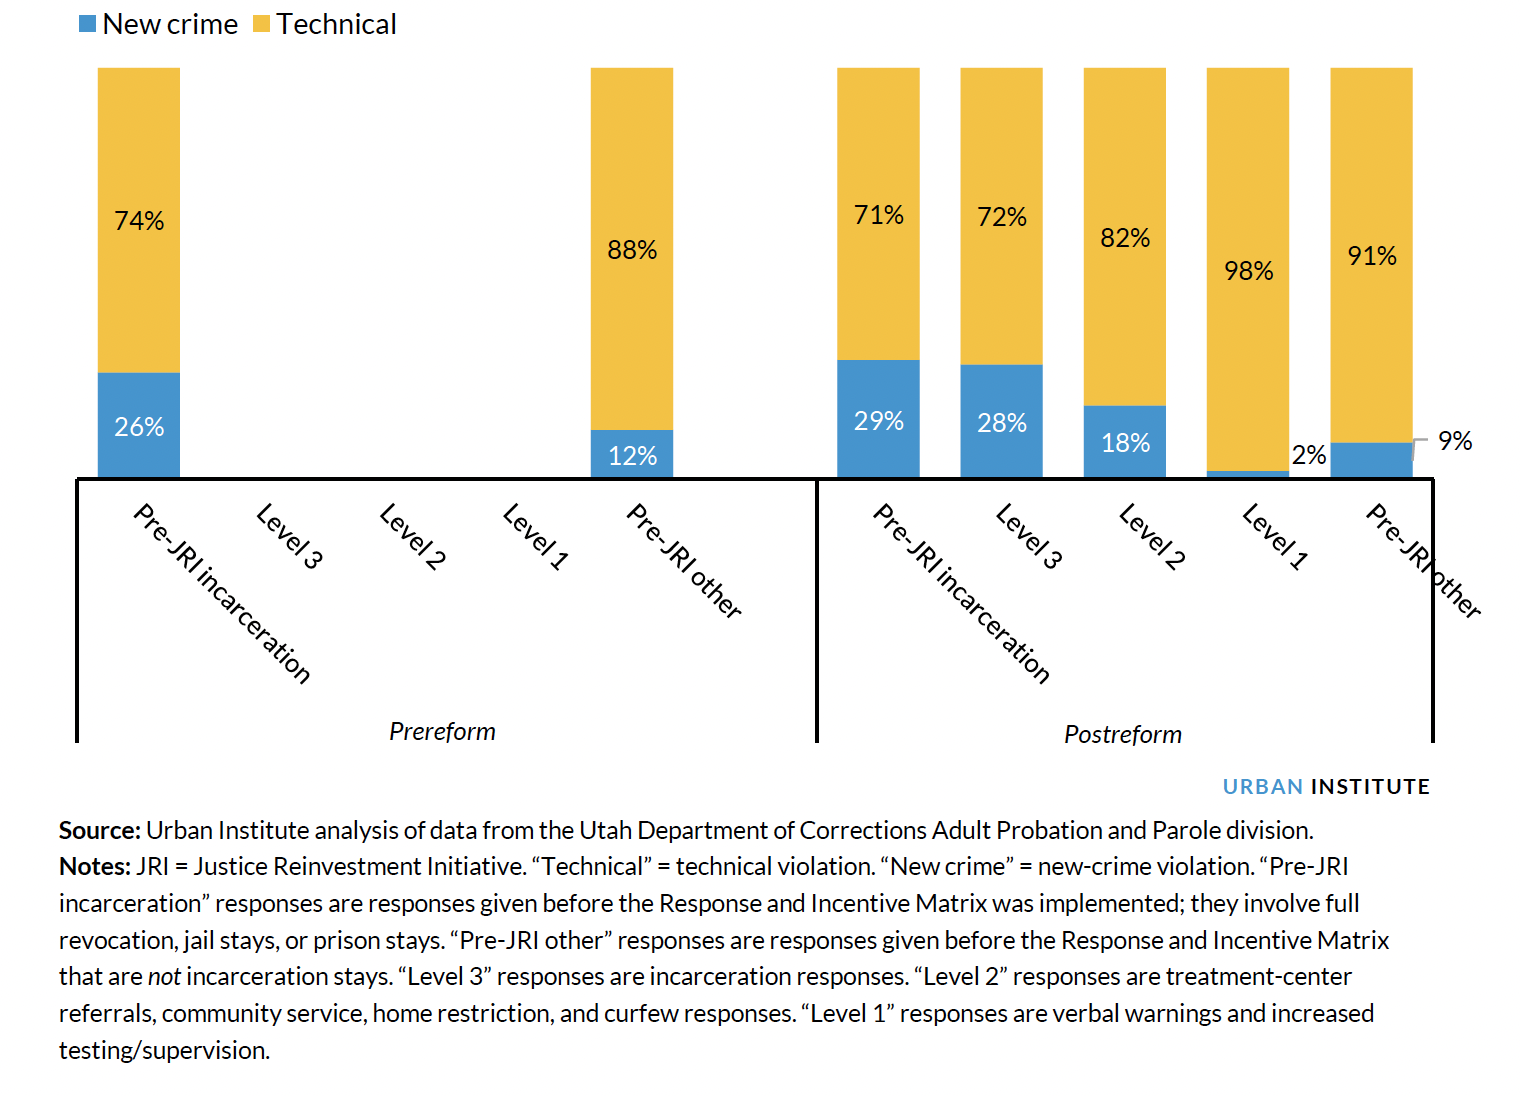
As figures 18 and 19 show, during the prereform period (2010–2015) and the postreform period (2016–2019), incarceration responses (e.g., Pre-JRI incarceration and Level 3) are more likely to be used for new crime violations than are nonincarceration responses. Roughly a third of incarceration responses for parole and over a quarter for probation were for new crime violations. However, all response types are more likely to be used for technical violations than new crime violations. As noted above, the number of violations increased by just over 50 percent from 2015 to 2019, and technical violations constituted 80 percent of all violations during that period.
Figure 18: Most Serious Violation Associated with a Violation Response among the Parole Population before and after Utah’s Community Supervision Reforms, 2010–19
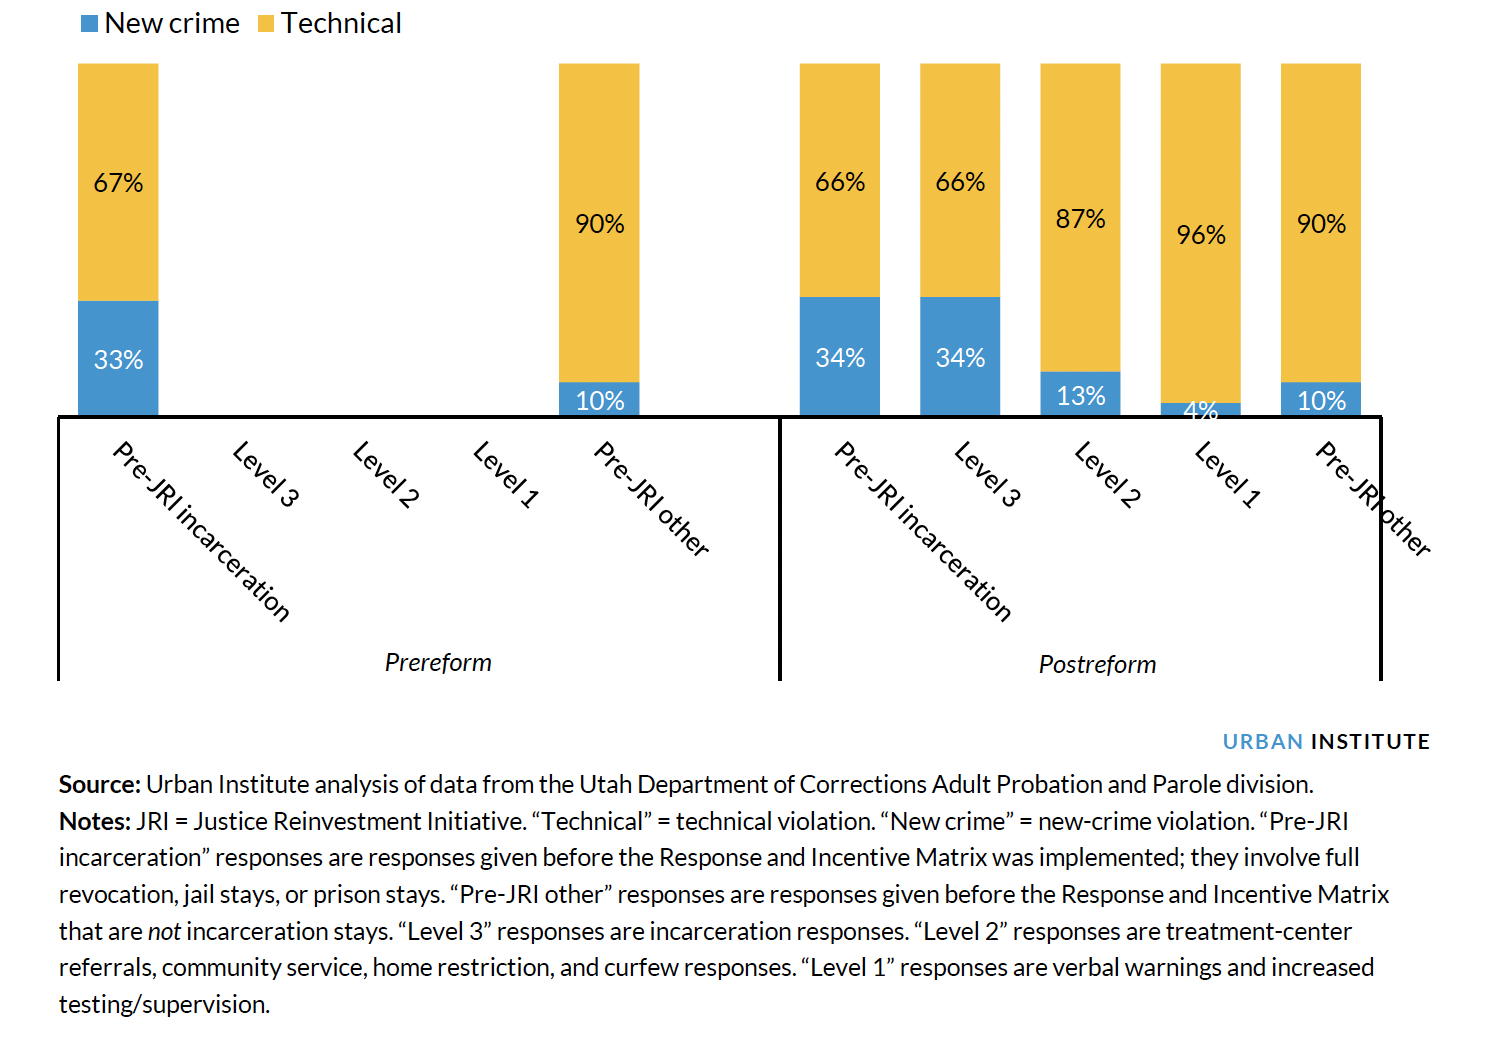
Figure 19: Most Serious Violation Associated with a Violation Response among the Probation Population before and after Utah’s Community Supervision Reforms, 2010–19
Unsurprisingly, given that more serious types of violations are more likely to receive incarceration responses, the data also show that terms that end unsuccessfully are more likely to have incarceration responses for supervision violations.10 For example, almost all of the people whose parole terms ended unsuccessfully in 2019 had experienced a graduated incarceration cap during their term as their most serious supervision response, compared with only 5 percent of people whose parole terms ended successfully. Moreover, roughly 87 percent of people whose probation terms ended unsuccessfully in 2019 had experienced a graduated incarceration cap or other incarceration response, and only 13 percent had received no incarceration response. Conversely, for successful probation completions, 73 percent had no incarceration response. Almost all community supervision terms that ended successfully received an incentive during the supervision term, while for unsuccessful completions, 26 percent of parole and 31 percent of probation completions in 2019 had received an incentive.
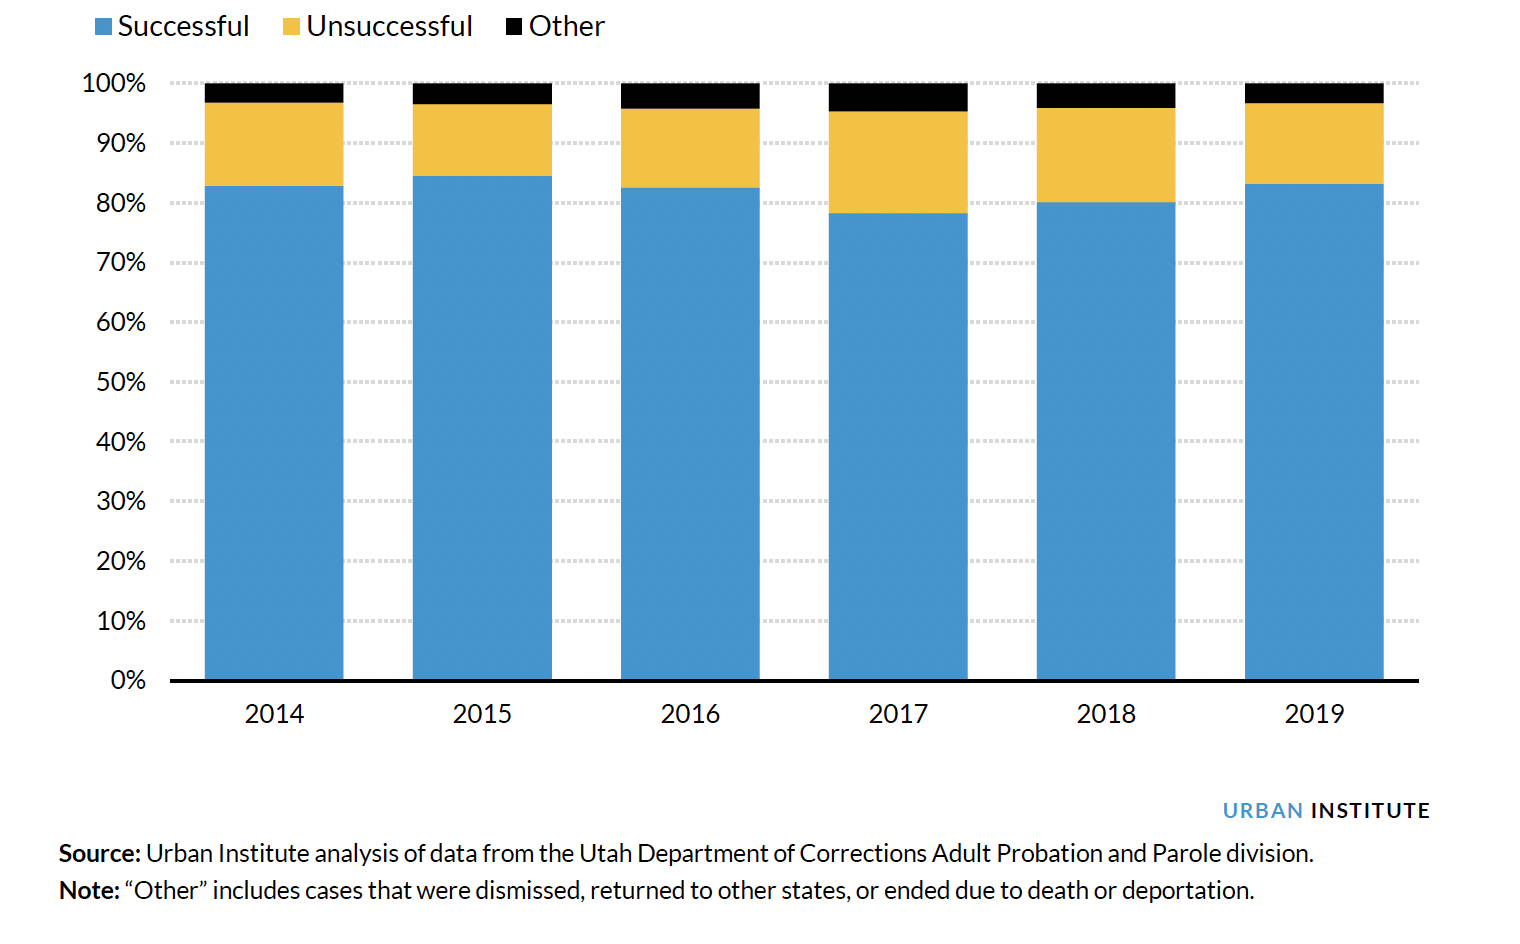
System Outcomes Show Steady Success Rates
As figure 20 shows, after decreasing from 2015 to 2016, the proportion of parole terms ending successfully stayed relatively flat at around 25 percent.11 Moreover, as figure 21 shows, by 2019, the proportion of the probation population that successfully completed increased to prereform levels (just over 83 percent).12 This is notable given Utah’s probation population is increasing and has an increasing proportion of people categorized as high or intensive risk.
Figure 20: Parole Completions by Type and Year in Utah, 2014–19
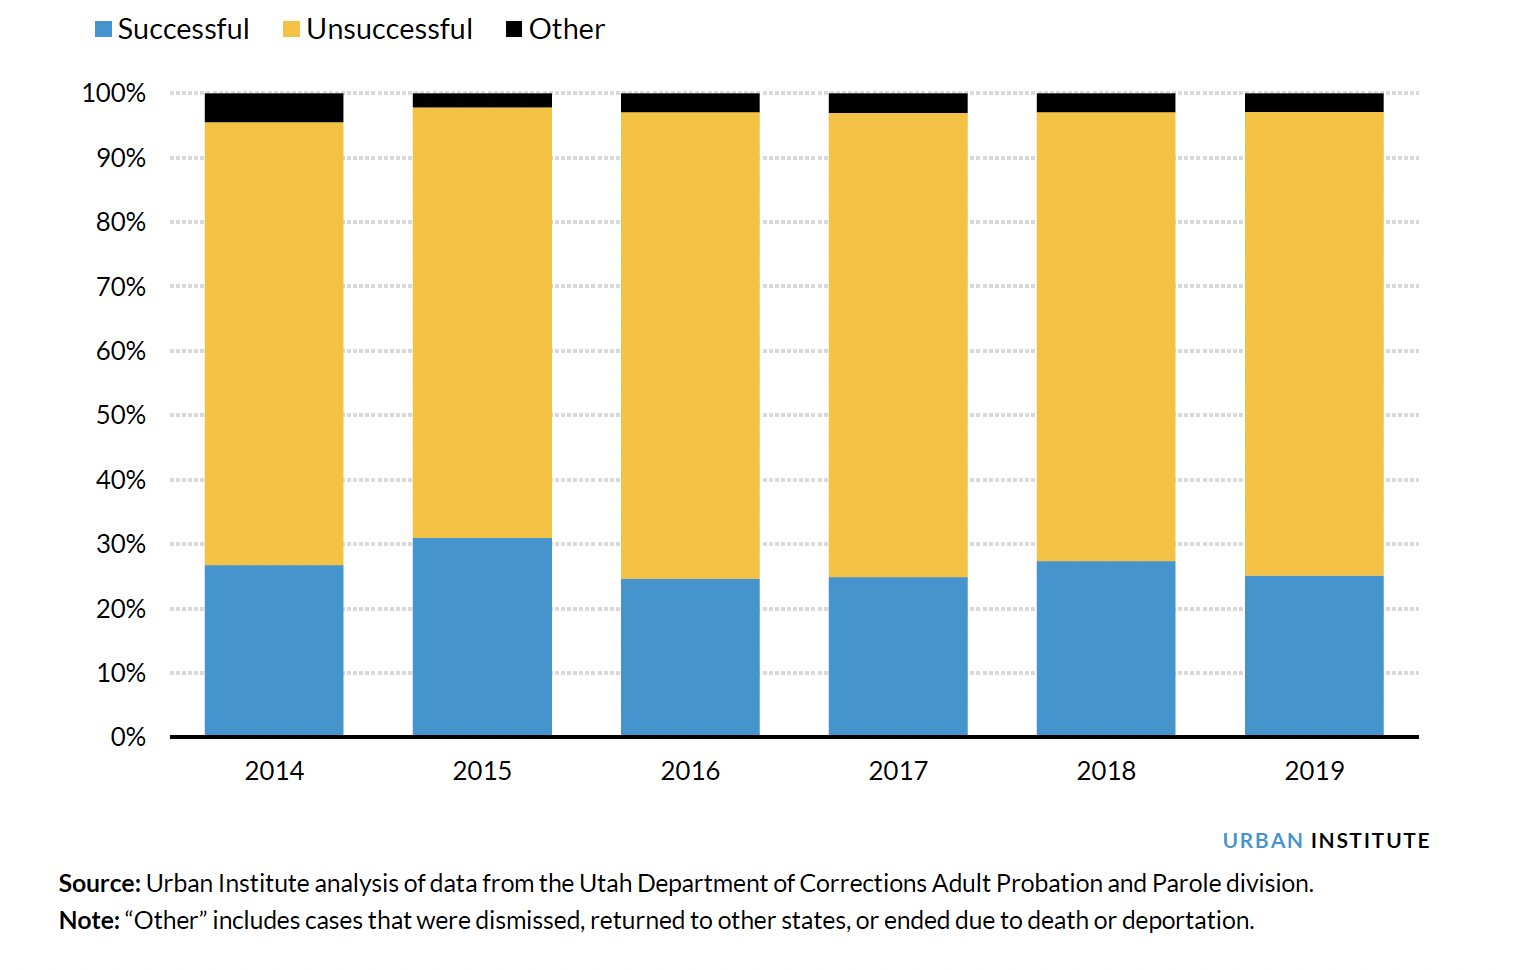
Figure 21: Probation Completions by Type and Year in Utah, 2014–19
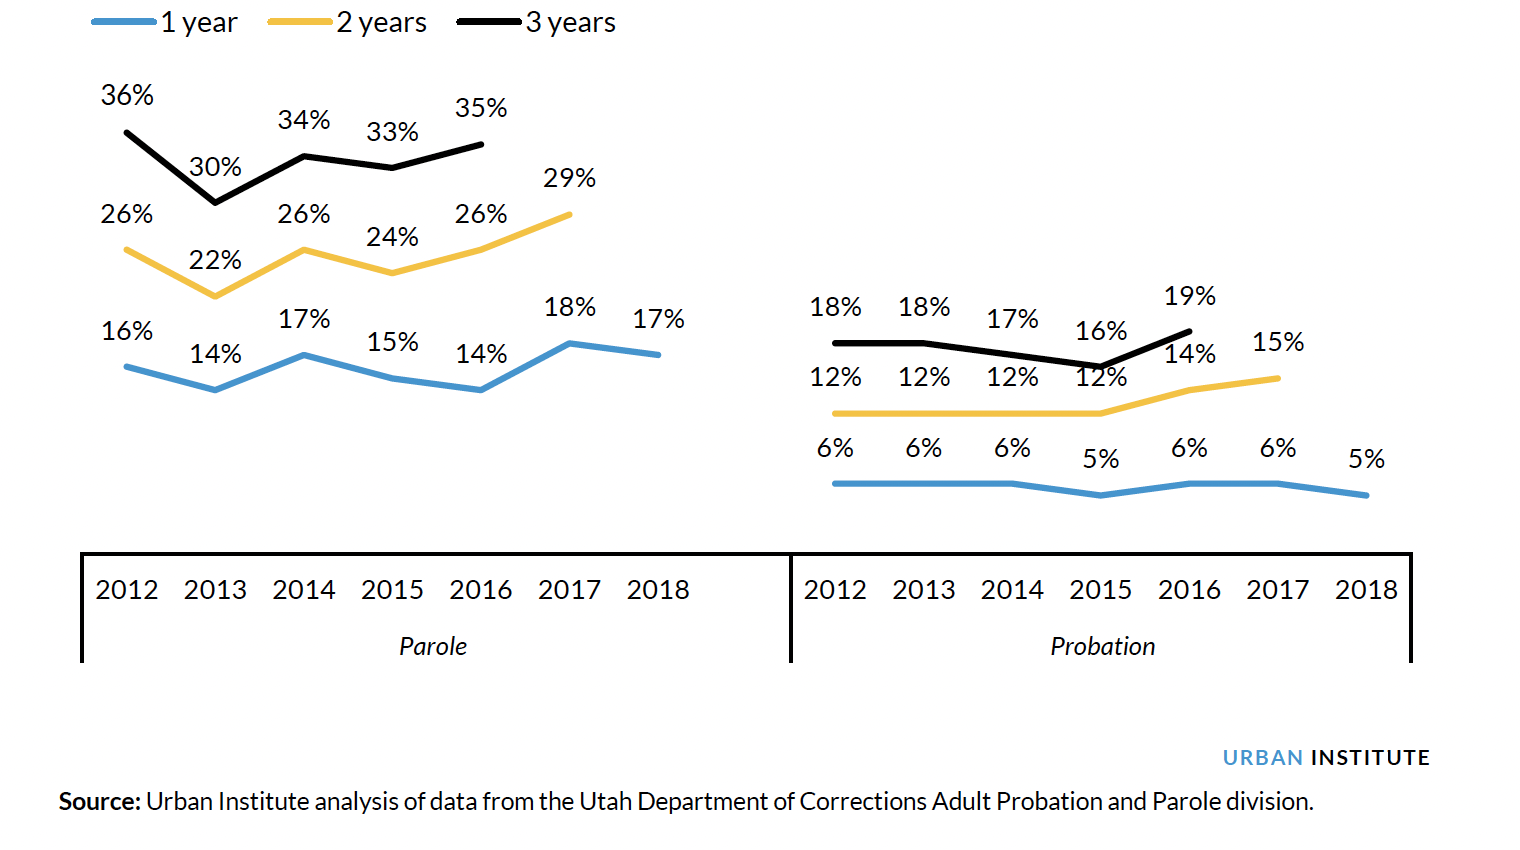
In addition, as figure 22 shows, recidivism rates for all community supervision completions remained stable, with three-year recidivism rates at 35 percent for people exiting parole and 19 percent for those exiting probation. For the purposes of this analysis, recidivism is defined as a referral to the UDC on a new felony conviction within one, two, or three years of discharge from supervision.
Figure 22: Recidivism Rates within One, Two, and Three Years of Ending Parole (Left) and Probation (Right) in Utah by Year, 2012–18
Cases with Incarceration Responses Are Associated with Higher Recidivism Rates Than Those without Them
We also explored the specific impact of incarceration responses on recidivism rates (for the purposes of this analysis, recidivism is measured by a referral to the UDC on a new felony conviction one year after discharge from supervision), and found that despite high overall rates of system success, individual cases that receive incarceration sanctions fare worse on measures of felony reconviction.
First, when examining the community supervision population during the postreform period (2016–2018), all cases on parole (both those that ended successfully and those that did not) that received an incarceration sanction had a one-year recidivism rate of 30 percent or higher,13 compared with 3 percent among parole cases with no violation response. During that period, the recidivism rate among all cases (successful and unsuccessful) on probation was 10 percent or higher each year,14 compared with 3 percent among probation cases with no violation response.
To better assess the association between receiving an incarceration response and recidivism, we conducted a propensity score matching analysis. People on felony probation and parole who received at least one graduated incarceration cap were matched along many characteristics to individuals who had at least one violation but did not receive a graduated incarceration cap. Within this matched sample, receiving a graduated incarceration cap is associated with significantly higher one-year recidivism rates. The predicted recidivism rate of people who received a graduated incarceration cap was 23 percent compared with 18 percent for the matched comparison group without a graduated incarceration cap.15
Conclusions and Recommendations
Although Nebraska and Utah have taken different approaches to using limited incarceration stays in response to community supervision violations, their approaches and justice systems have some things in common. For instance, in both states, the supervision agencies faced growing supervision populations and greater shares of cases assessed as high or very high risk during the implementation period. Other similarities include the following:
- Violation responses have changed in both states, from revocations or prereform incarceration sanctions toward structured short jail stays or incarceration caps.
- Although overall incarceration stays increased postreform, the number of full revocations from felony probation decreased in Nebraska and the proportion of violations that received an incarceration response decreased in Utah.
- Incentives were used more in both states after reform.
- Cases that received incarceration responses had more serious violations than cases that did not. The use of these more severe responses for cases with more violations and more serious violations means the states were following a graduated response approach.
- Successful completions for both states’ supervision systems either increased immediately after reforms were implemented or increased after a brief decrease. Further, among Nebraska’s probation population, the proportion of revocations and closures resulting in incarceration because of technical violations decreased.
- Despite the system-level success rates, the use of time-limited incarceration responses did not make successful supervision completion more likely for particular cases in Nebraska; in Utah, cases that received time-limited incarceration responses had higher recidivism rates than similar cases that did not.
Based on these findings, we recommend that states considering adopting these types of incarceration responses do the following:
- Given the mixed results showing improved system-level outcomes but troubling individual-level impacts, we recommend that states determine the purpose or goal of using time-limited incarceration responses and closely track system-level metrics (e.g., violations, revocations, length of stay in prison on revocation, use of jail days on supervision) and outcome metrics (e.g., recidivism).
- Where possible, states should establish policies and practices that meet the goals of their approaches to responding to supervision violations, and they should limit the use of incarceration because of its potential criminogenic impact (The Pew Charitable Trusts 2019 and Petrich et al, 2021).
- Continue to use and record incentives as part of the graduated response approach.
- Explore whether different durations of incarceration responses to supervision violations lead to better or worse outcomes at the system and individual levels.
Notes
- Jake Horowitz, “1 in 55 U.S. Adults Is on Probation or Parole,” Pew Charitable Trusts, October 31, 2018, https://www.pewtrusts.org/en/research-and-analysis/articles/2018/10/31/1-in-55-us-adults-is-on-probation-or-parole.
- Case management term is how Nebraska authorities describe a probation term which could entail a person serving one probation sentence or multiple concurrent or consecutive probation sentences. It is the unit of measurement for supervision terms we use in this analysis of Nebraska’s policy.
- When we present data by year for Nebraska, we are referring to fiscal year.
- The averages for people without custodial sanctions are less than 1.0 because they include cases with zero violations.
- Successful completions include those listed as “probation completion” and “early release” in the data from the Administrative Office of the Courts and Probation.
- The recidivism rate is measured as a reconviction of a misdemeanor 2 or higher within three years of successful discharge.
- Within our matched sample, cases with no custodial sanctions had a revocation rate of 60 percent and a successful-completion rate of 27 percent, and cases with custodial sanctions had a revocation rate of 61 percent and a successful-completion rate of 27 percent. See the technical appendix for more detailed information.
- “Level 3 other response” is likely to be an incarceration response, but could include a court or board hearing and subsequent community correctional center placement or require more than 90 days of GPS monitoring.
- “QuickFacts: Utah,” US Census Bureau, accessed October 11, 2021, https://www.census.gov/quickfacts/UT.
- This specific analysis categorized unsuccessful completions as supervision terms that ended in revocations or other incarceration, and those where people were listed in the data as either absconders or unsuccessful discharges.
- The “successful” category includes everyone not categorized as “unsuccessful” (people who had end statuses that indicated a return to incarceration) or “other” (which primarily consists of people who died, were deported, or had a compact return to another jurisdiction).
- Successful completion includes exit types that did not result in a prison return (for parole) or prison commitment (for probation), expired sentences, or probation sentences terminated with violations that did not result in prison commitment.
- For those with a pre-JRI incarceration sanction, the recidivism rate was 30 percent. For those with a level 3 sanction, it was 33 percent.
- For cases with a pre-JRI incarceration sanction the recidivism rate was 10 percent. For cases with a level 3 sanction, it was 14 percent.
- The predicted one-year felony reincarceration rate among people who received a graduated incarceration cap was 23 percent, compared with 18 percent for the matched comparison group without a graduated incarceration cap. See the technical appendix for a detailed explanation of our analytic approach.