Data Findings
Nevada’s statewide COVID-19 numbers hover near the national median
Background information on how the coronavirus spread throughout Nevada provides context to its effects on the criminal justice system. While Nevada announced its first positive case of COVID-19 on March 5, 2020,23 the state saw a significant spike of new cases between late November 2020 and January 2021, and its largest peak of new cases in January 2022.24 This pattern is in line with the national trend of new cases.25 The variables used to assess community transmission include case rates, hospitalizations, and death rates. As of November 16, 2020, the beginning of its first peak, Nevada had a seven-day case rate of 361 per 100,000. With the spread of the Omicron variant, Nevada’s seven-day case rate per 100,000 increased to 814 as of February 1, 2022. This rate is lower than 29 states, though deemed a high level of community transmission, per the CDC.26 Looking beyond case rates at hospitalizations, between August 1, 2020, and December 31, 2021, Nevada had 41,647 total new hospital admissions of patients with confirmed COVID-19. During the same period, Arizona had 95,558, Utah had 27,100, and Oregon had 21,660.27 Looking specifically at the number of people who died from COVID-19 in the state, the CDC reported that, as of December 30, 2021, Nevada had the 20th highest death rate out of the 50 U.S. states, with 272 deaths per 100,000. For context, the state with the highest death rate was Mississippi and the lowest was Vermont, with 350 and 70 deaths per 100,000, respectively. Compared to Nevada’s neighboring states of Arizona, California, Idaho, Oregon, and Utah, only Arizona exceeds Nevada in the death rate per 100,000.28
Table 2. COVID-19 death rates in Nevada and neighboring states
| State | Death Rate per 100,000 |
|---|---|
| Arizona | 332 |
| Nevada | 272 |
| Idaho | 232 |
| California | 191 |
| Oregon | 133 |
| Utah | 117 |
Nevada’s violent and property crime rates declined in 2020, but homicides increased
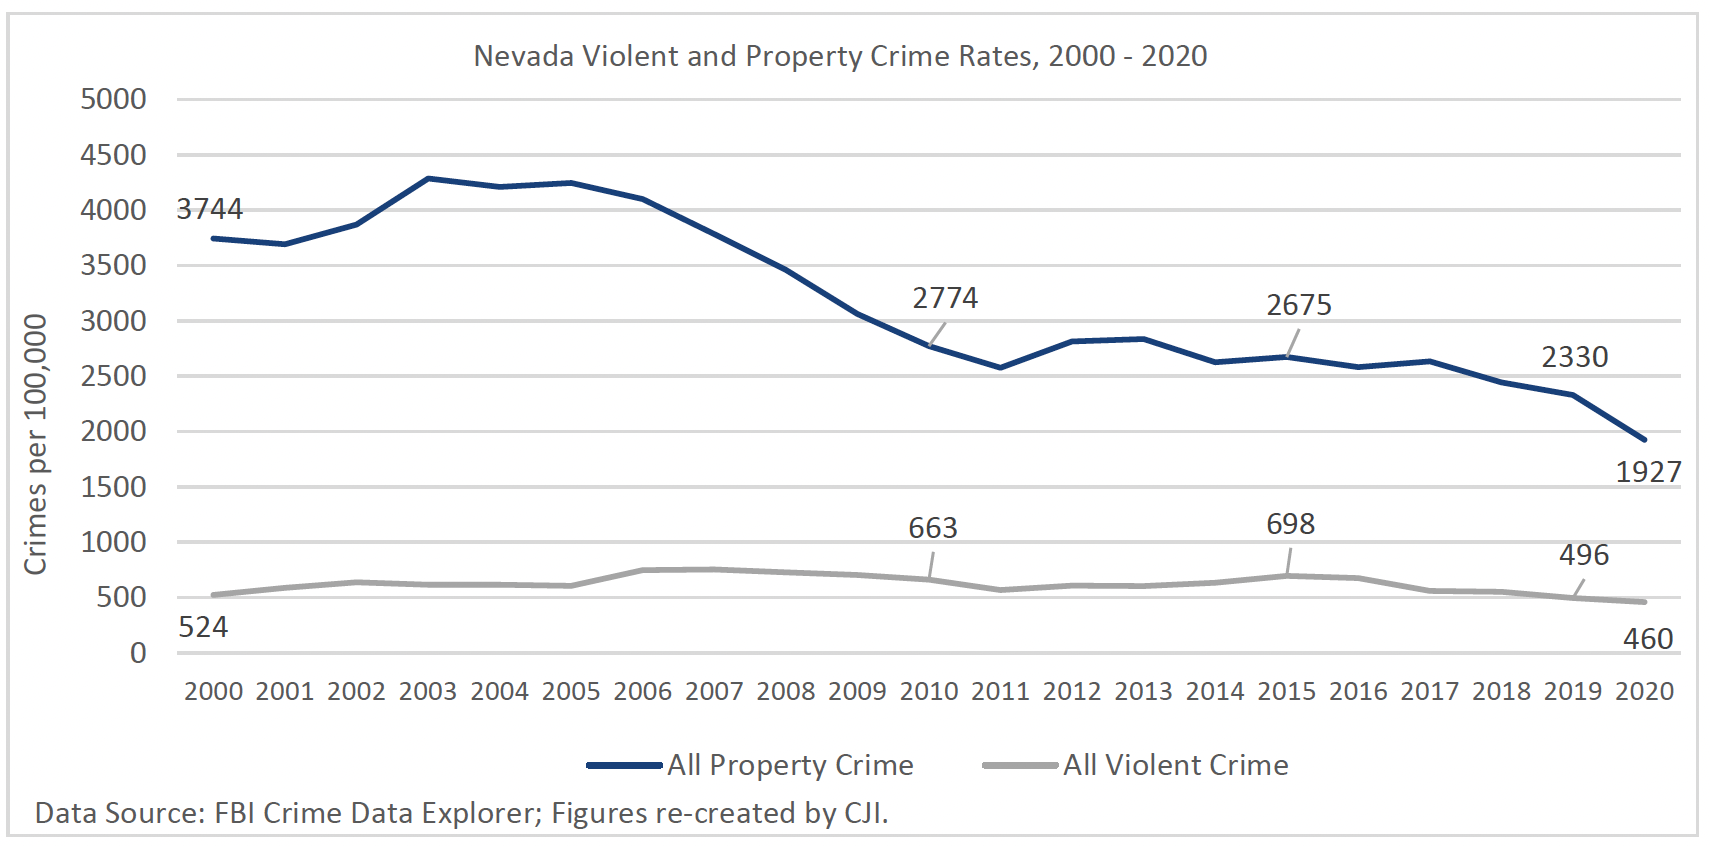
Crime rates in Nevada during 2020 and 2021 only partially align with recent national crime trends, and do not reflect the 2020 rise in violent crimes observed at the national level. Data from the most recent Uniform Crime Reports (UCR)29 show that Nevada’s violent crime rate decreased 7 percent from 2019 to 2020. UCR trends show that violent crime overall is down 35 percent from 2009 to 2020 (see Figure 2). Despite this decrease, Nevada’s homicide rate increased from 2019, as did homicide rates nationally. In 2020, the state averaged just under six homicides per 100,000 people compared to just under five homicides per 100,000 the year prior. Notably, Nevada’s 2020 homicide rate was lower than the state’s homicide rates from 2013 through 2018. Finally, mirroring national trends, Nevada’s property crime rate consistently declined over the past few years, dropping nearly 17 percent from 2019 to 2020.
Figure 2. Nevada’s violent crime rates declined in 2020, contrary to national trends
The pandemic resulted in fewer case filings and a focus on more serious offenses 30
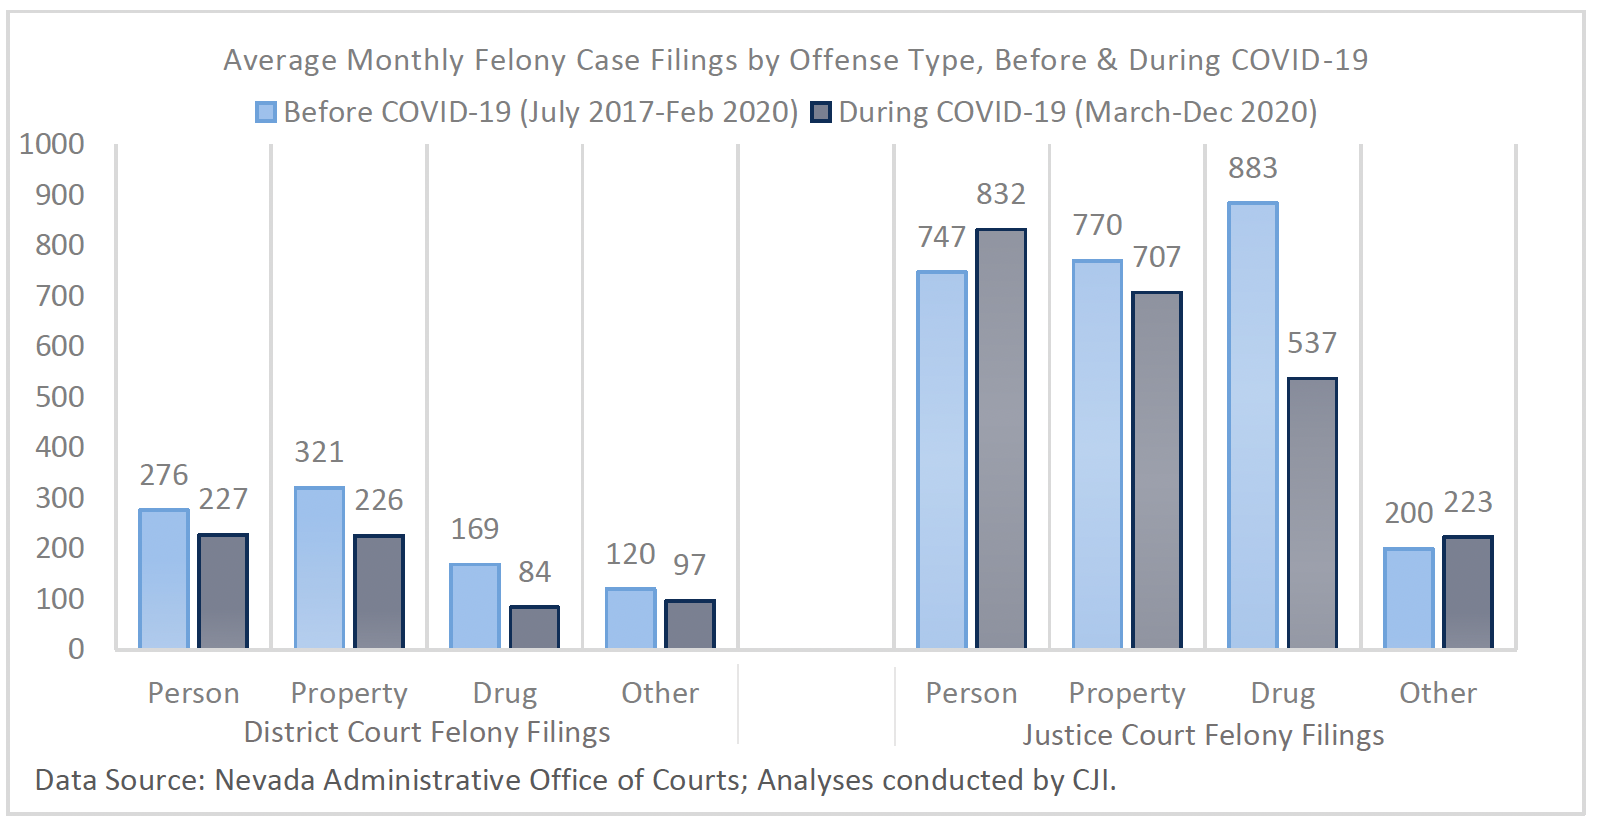
During the shutdown, fewer people were out committing offenses and officers booked fewer people for less serious offenses. As a result, data from the Administrative Office of the Courts (AOC) shows decreased felony filings from the Justice and District Courts. Monthly felony filings in Nevada Justice Courts declined by 12 percent, with over 300 fewer monthly filings; felony filings in District Courts, following transfer from Justice Court, decreased by 28 percent during the pandemic, with over 250 fewer monthly filings. When looking at specific case types, the greatest decline in filings was in the number of drug offenses, which dropped by nearly 40 percent in Justice Courts and over 50 percent in District Courts (see Figure 3). This finding aligns with reports from various stakeholder interviews indicating that the pandemic focused strained law enforcement and prosecutorial resources on more serious offenses.
This focus on more serious offenses was further reflected in case filings from the Eighth Judicial District, Nevada’s largest District Court. Felony filing trends from the Eighth District resemble trends in the overall AOC data, with monthly felony filings decreasing by 26 percent during COVID-19. With fewer filings for less serious offenses (e.g., drug offense filings dropped by half), the proportion of case filings by offense types shifted to more serious, person-based offenses during the pandemic. The share of filings during COVID-19 were increasingly comprised of person, sex, and “other” offense types.31 For sex and “other” offense types, this upward proportional trend continued into the first half of 2021.
Figure 3. Average monthly case filings declined most for drug and property offenses in District or Justice Courts
More felony person cases were filed than resolved in Justice and District Courts 32
Similar to filings, felony dispositions also declined during COVID-19, dropping in Justice Courts by an average of around 23 percent, or over 580 fewer dispositions each month, and decreasing in District Courts by 26 percent, or around 230 fewer monthly dispositions. When looking at specific offenses, the data show there were more dispositions than filings during COVID-19 for property and drug offenses in District Court, indicating that the District Courts were “keeping up with” or “staying ahead of” these filings. However, this was not the pattern for person offenses: while District Court person offense filings were down 18 percent, District Court person-based case dispositions dropped even further, down an average of 21 percent each month.33 Such filing-to-disposition imbalances were even starker in Justice Courts, with an average of 80 more person-based felonies being filed each month during COVID-19 while around 80 fewer person-based felony dispositions occurred in the same period. The effects of such imbalances were also evident in patterns from the Eighth Judicial District, where about 56 percent of pending cases filed during COVID-19 were for person or sex-based offenses, a notably higher percentage of more serious pending cases than those still pending from filings before COVID-19.
Felony cases greater than one year in age increased in the District Courts
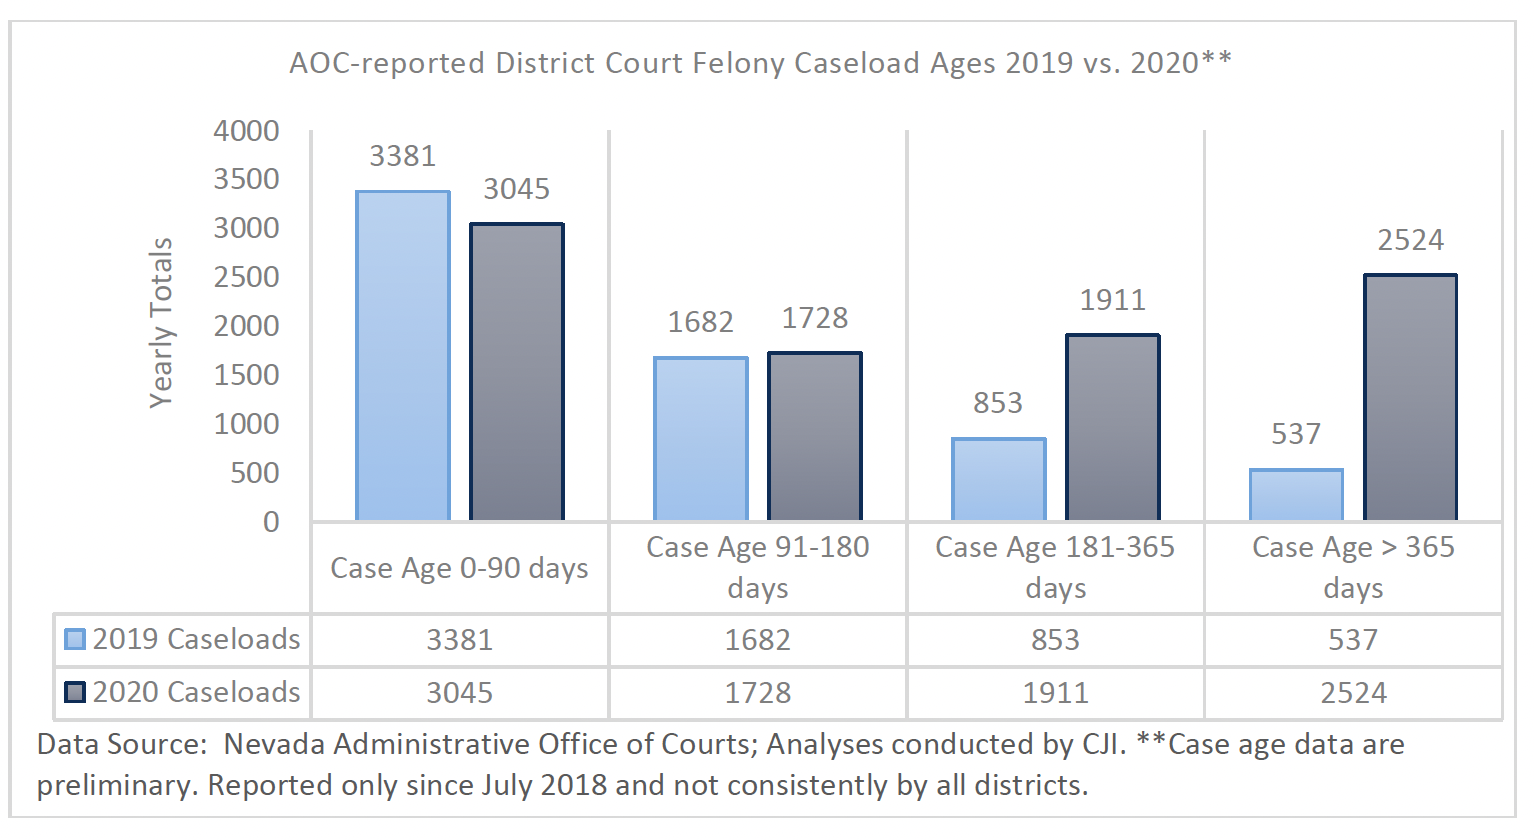
Reflecting the decrease in the number of dispositions, the AOC data indicated that criminal case age, or the number of days since a case was filed, grew during the pandemic. This is illustrated in Figure 4, showing the annual total number of cases that were older than a year and still unresolved jumping from 537 in December 2019 to 2,524 cases by December 2020. It is likely that cases grew older due to reduced court capacities as the result of the pandemic. AOC data also showed increased pending caseloads in Justice Courts, with over 7,800 pending cases by June 2020 compared to just over 5,000 in June 2019. Many courts, including Nevada’s two busiest District Courts, closed almost entirely between April and August of 2020. The courts have implemented innovative methods to speed dispositions in light of the backlog.
Figure 4. Case age increased significantly during the pandemic, most notably for cases pending over a year
Jail and prison admissions dropped significantly during the pandemic, driven by fewer admissions for non-person offenses
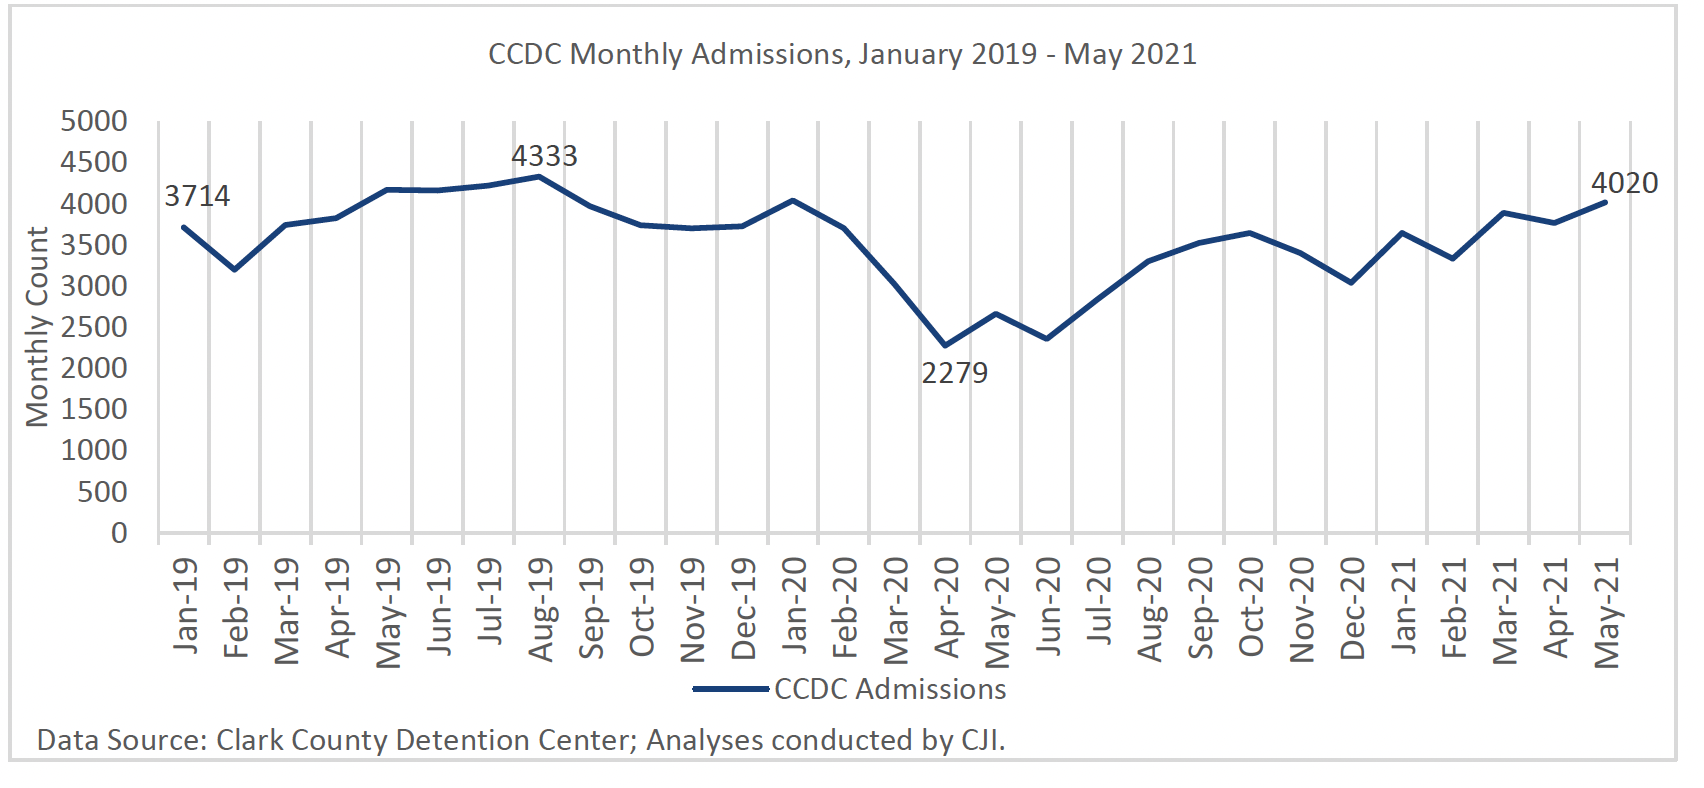
Using data from the state’s largest jail, CJI explored monthly admissions to the Clark County Detention Center (CCDC) and found a steep decline at the start of the pandemic, with admissions reaching a monthly low of 2,279 in April 2020 (see Figure 5). The average monthly number of jail admissions during COVID-19 (3,010) was 22 percent lower than before COVID, with over 850 fewer jail admissions each month. Since the April 2020 low, however, monthly jail admissions gradually returned to levels resembling pre-pandemic admissions, with 4,020 jail admits in May 2021.
Figure 5. Monthly CCDC admissions declined rapidly in Spring 2020 but gradually returned to pre-pandemic levels
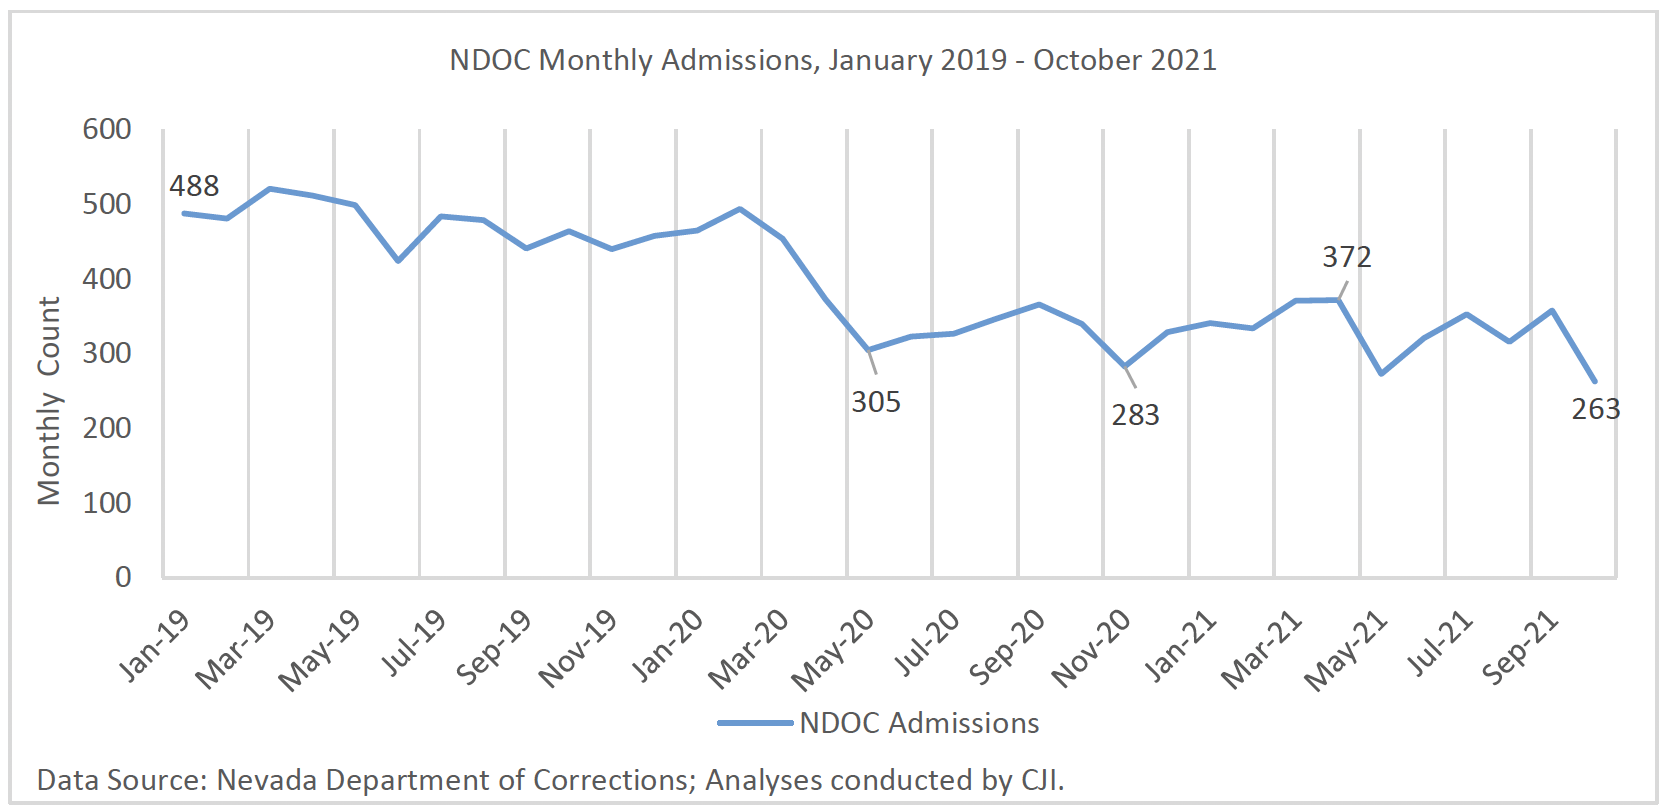
Similar to the early trends observed in CCDC data, admissions to Nevada’s prisons also declined. From estimates starting in March 2020 (see Figure 6) NDOC’s monthly admissions were 27 percent lower, on average, during COVID-19 compared to pre-pandemic admissions (see Table 1 for data-defined periods), with nearly 130 fewer admissions every month from March to December 2020. Monthly admission estimates declined an additional 4 percent in 2021, with an average of 330 admissions each month compared to 475 per month before COVID-19. This decline occurred across all offense types34 – but most steeply among drug offenses – dropping 41 percent from an average of 84 admissions per month in the period leading up to COVID-19 to an average of 49 per month during the pandemic. Large monthly declines in admissions were also evident for property offenses and the “other” offense category, both of which were down by around 30 percent during COVID-19. Smaller declines were observed for monthly admissions for person-based offenses, with admissions for both sex and violent offenses declining only 20 percent, and therefore comprising a comparatively greater share of admissions during COVID-19.
Figure 6. Dramatically lower monthly NDOC admissions in Spring 2020 fluctuated but remained low through 2021
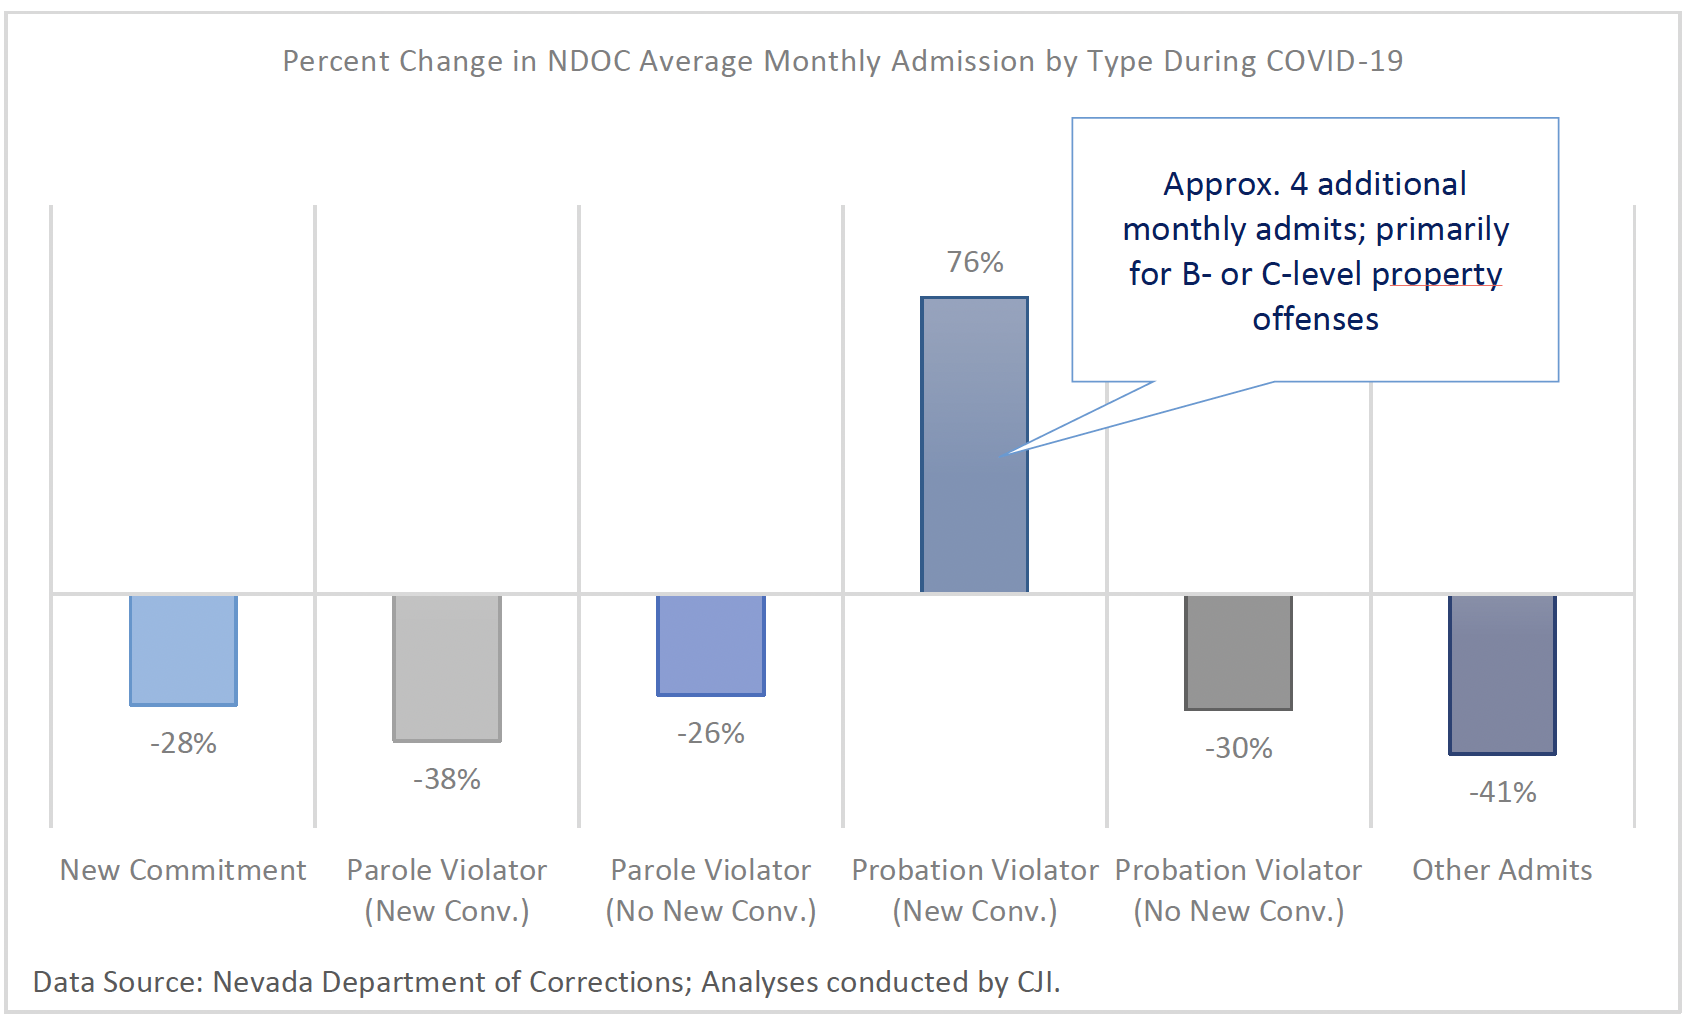
NDOC admissions declined for nearly all admission types (e.g., new commitments versus violations) except for probation violations for new convictions. The monthly average for those entering prison for a new commitment, which comprises over half of all NDOC admissions, dropped 28 percent during COVID-19, while the monthly average of people admitted for parole or probation violations without new convictions35 dropped 26 and 30 percent, respectively. In contrast, admissions for individuals on probation with a new conviction, which represents just 2 percent of all NDOC admissions, increased by approximately four additional admits per month (see Figure 7).36
Figure 7. Prison admissions declined across nearly all admissions types during COVID-19
Releases from jails and prisons dropped during the pandemic
Monthly releases from CCDC saw a significant dip around March 2020, and a new low of 2,393 releases was recorded in June 2020. From there, as early as July 2020, CCDC monthly releases began a climb back to pre-pandemic levels and continued to grow through the first several months of 2021 (see Figure 8). Overall, the average number of monthly releases during the pandemic was 3,030, over 820 fewer releases each month – a 21 percent decline – compared to average monthly jail releases in 2019. Notably, these average monthly estimates rebounded to just 5 percent fewer releases than 2019, with approximately 3,663 releases for each month from January to August 2021.37
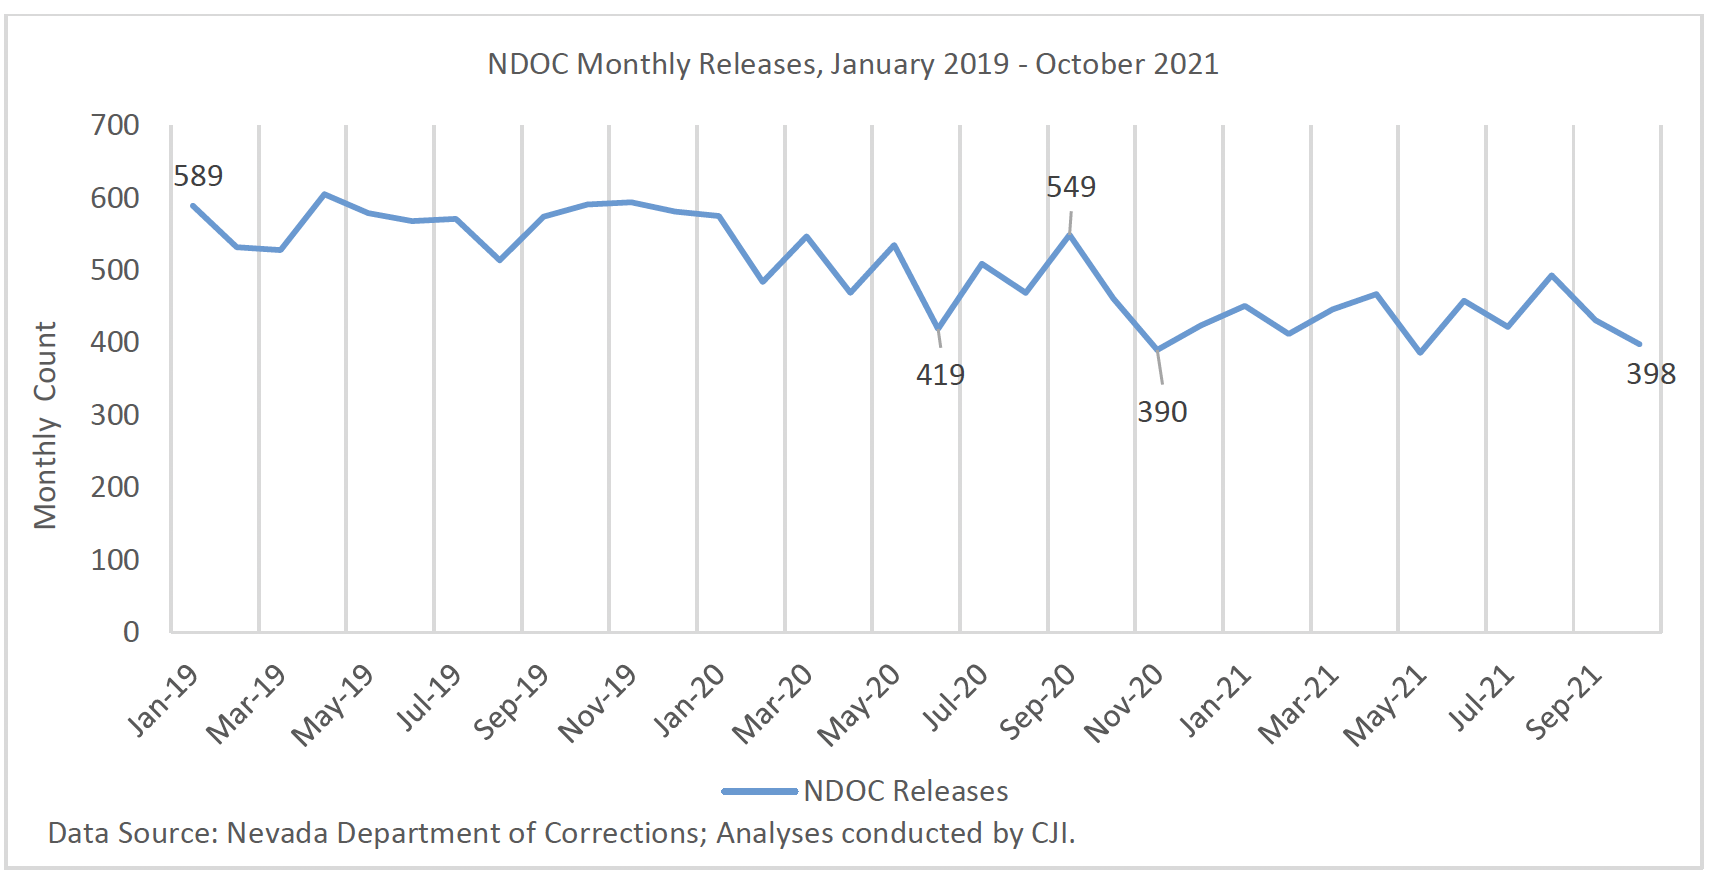
The prison system also experienced a decline in releases during COVID-19 that continued to fluctuate well into 2021 (see Figure 9). Average monthly releases dropped from 563 prior to the pandemic to 477 releases during the COVID-19 period. Despite a surge in releases around September 2020,38 compared to before the pandemic, there were nearly 850 fewer monthly releases from NDOC from March to December 2020. In 2021, prison releases dropped further, with about 30 fewer releases per month compared to during COVID-19, for an overall decline of 19 percent.39
Figure 8. Average monthly jail releases declined by 21 percent during COVID-19
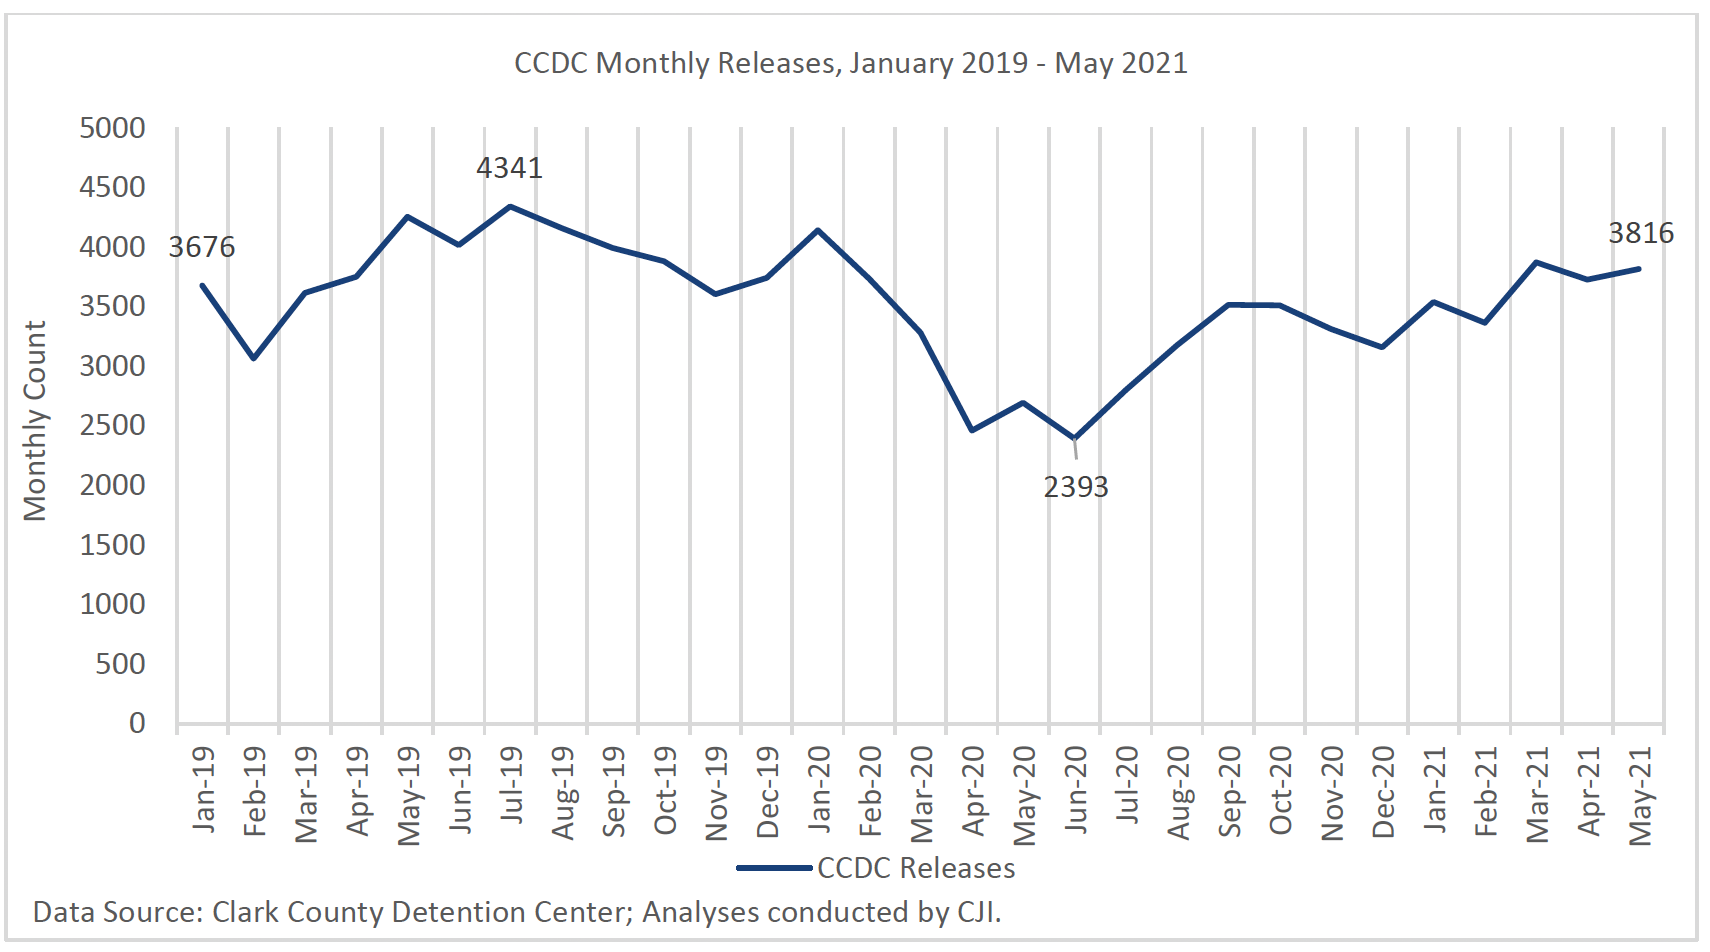
Figure 9. NDOC average monthly releases dropped 19 percent compared to before COVID-19
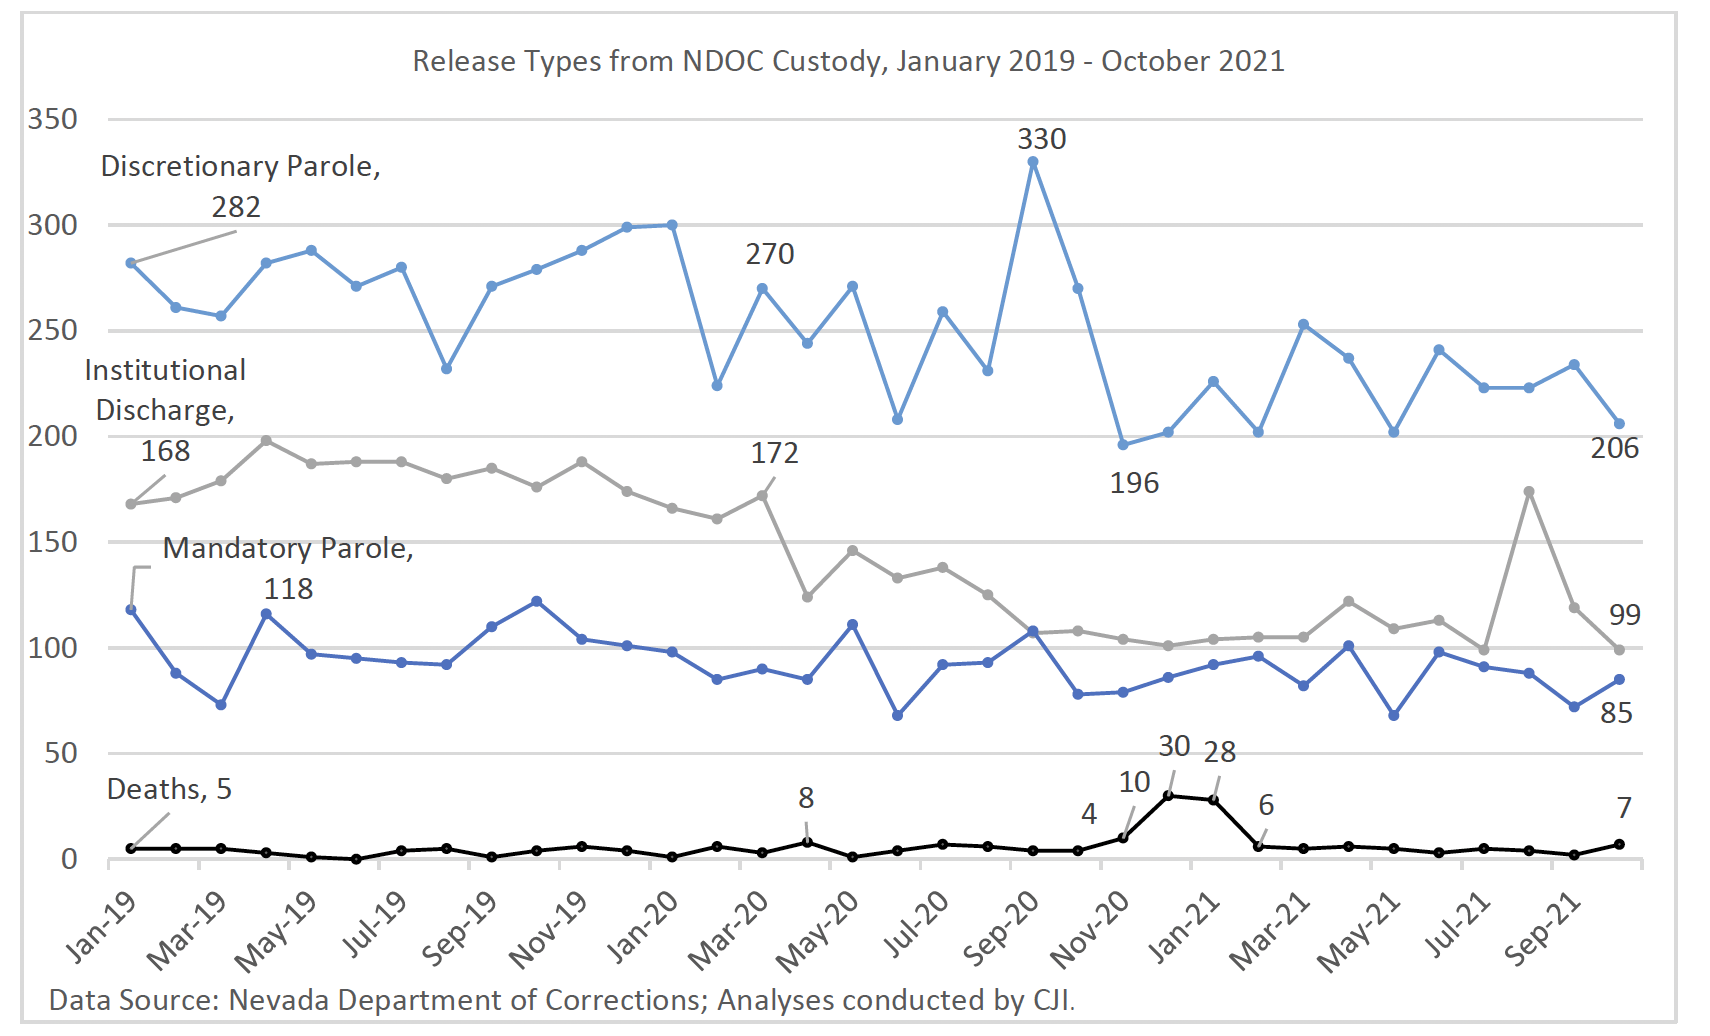
Virtually all releases from an NDOC facility (98 percent) are the result of three mechanisms: discretionary release on parole, institutional discharge, and mandatory parole release. Discretionary release on parole is the most common at approximately 50 percent of releases, followed by institutional discharge at 30 percent, and mandatory parole release at 19 percent. While all three release types declined since the start of COVID-19, institutional discharges experienced the most significant drop during the pandemic, falling first by 30 percent, and then by an additional 9 percent since the start of 2021 (see Figure 10).
Institutional discharges include both releases at the expiration of a person’s sentence and several statutory mechanisms that NDOC can utilize to release individuals. Both data and interviews suggest that these tools were rarely used during the pandemic due to decisions of NDOC and limitations in statutory eligibility. The available mechanisms include residential confinement,40 medical release,41 and temporary work furlough.42 The residential confinement transfer is designed for individuals who have had institutional successes, but eligibility is limited to those never convicted of anything more serious than a category C felony. Medical release allows NDOC to release individuals who are terminally ill, but the law only allows release when the individual is within 18 months of death. Lastly, the department can release individuals through temporary furlough for family emergencies, work placements, and any activity approved by the director and the Parole Board. Interviews suggested that releases on work furlough were limited during the pandemic, in large part due to inability to find placements.
Figure 10. Declines in all release categories except death, which more than doubled during COVID-19
COVID-19 resulted in fewer hearings and fewer releases granted by Parole Board
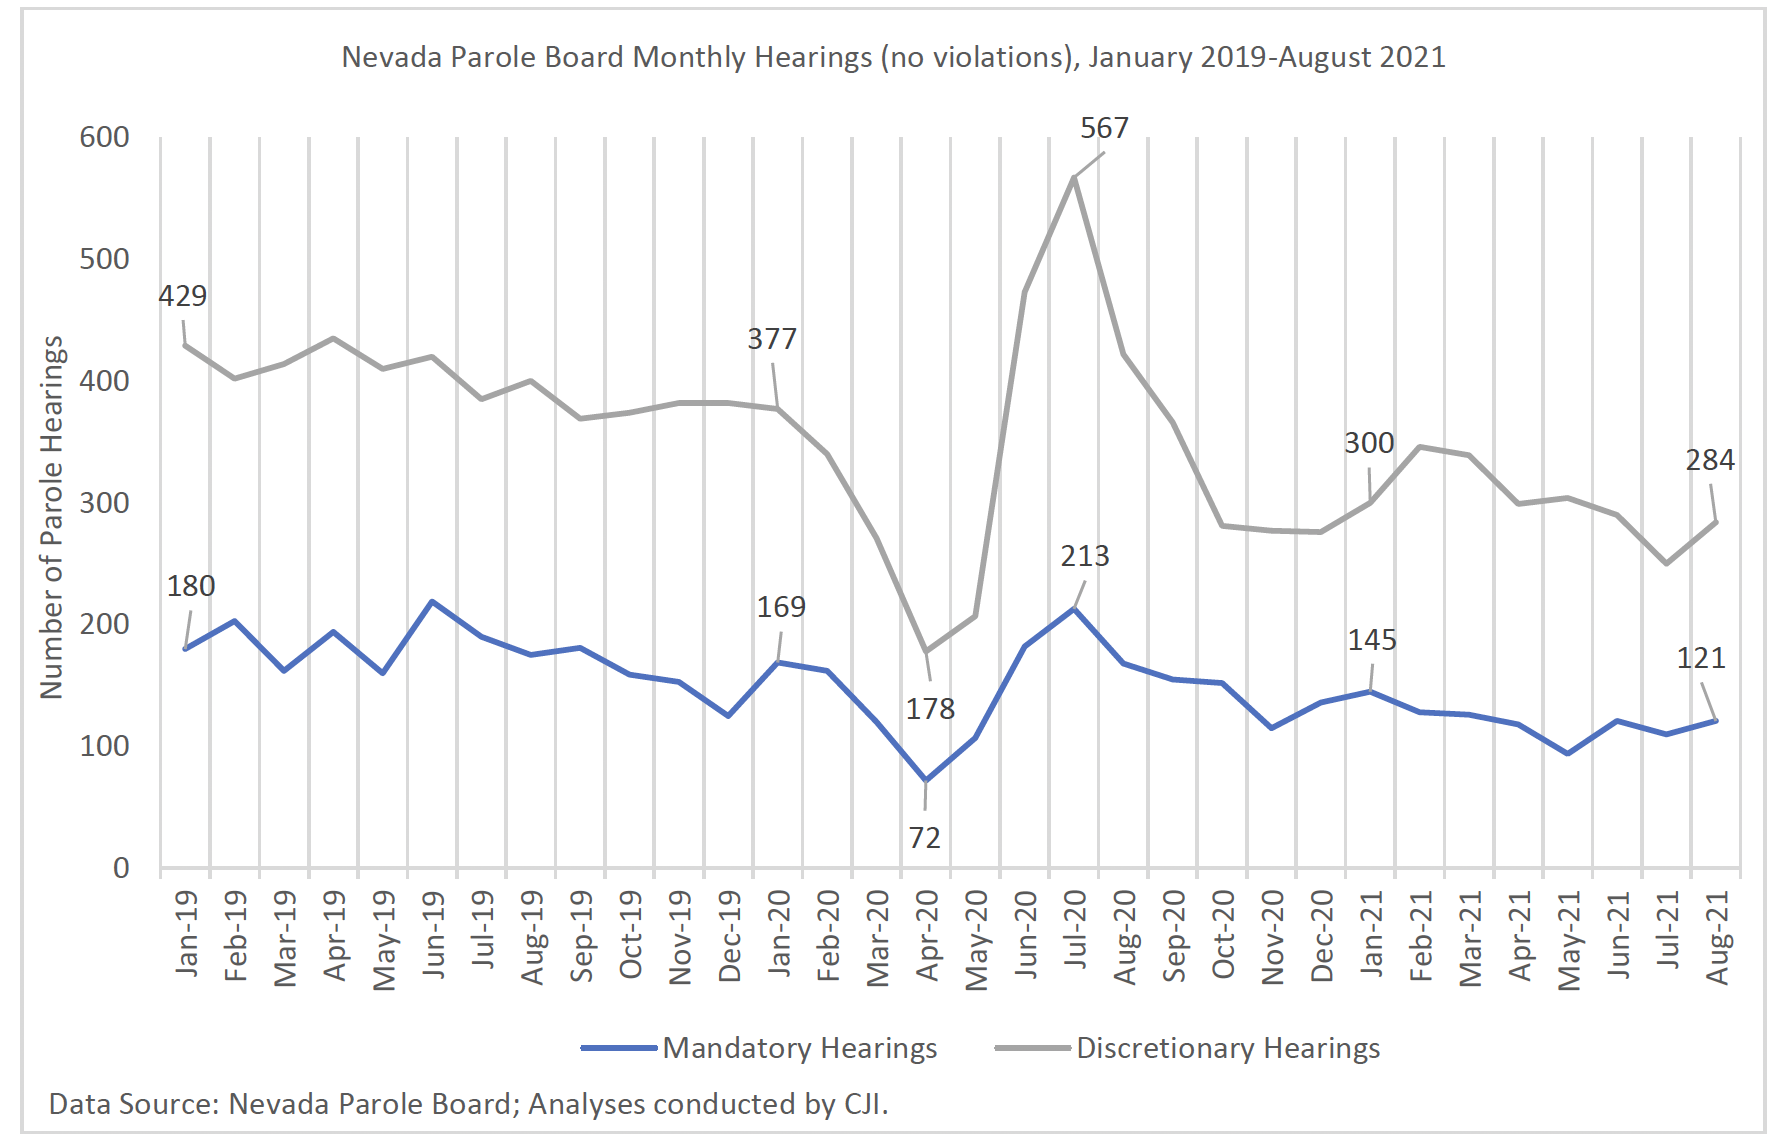
At the onset of the pandemic, Governor Sisolak issued an emergency directive closing all state agencies to the public, from March 20 through May 31, 2020. This directive removed the Parole Board’s ability to hear cases during that period, and all in-person parole hearings were effectively suspended until June 2020. State statute does not allow the Board to deny parole without an in-person hearing, but it does allow the Board to grant parole in-absentia, without a hearing.43 As such, the Board worked hard to review all individuals deemed eligible for parole by NDOC and granted parole for those who fit the in-absentia eligibility criteria outlined in statute in April and May 2020.44 Despite the Board’s ability to grant parole without an in-person hearing, the total number of parole hearings declined between 2019 and 2020. By the end of 2020, around 50 percent of NDOC’s 2020 end-of-year population (n=11,481) had parole hearings, compared to 53 percent of the 2019 end-of-year population (n=12,929) (see Figure 11).45 As for hearings held in 2021, there were approximately 60 fewer per month for a yearly estimate of over 700 fewer total hearings than in 2020. Many factors contributed to this decline, including a smaller NDOC prison population and an increasing percentage of individuals in custody on a serious offense.
This decrease in the number of hearings is similarly reflected in the decline of parole releases from NDOC. While institutional discharges had the greatest drop, both discretionary and mandatory parole releases declined following the emergence of COVID-19. NDOC data show that discretionary parole releases declined 9 percent (25 fewer releases) each month during the COVID-19 period and mandatory parole releases dropped 10 percent (10 fewer releases) each month (see Figure 10). Again, it is important to note that both the decreasing size and more serious composition of the NDOC population may explain the decline in parole hearings.
Figure 11. Dramatic fluctuations in parole hearings netted a 16 percent decline from March to December 2020
The share of parole hearings for more serious offense types grew during COVID-19 and into 2021
Similar to the changes in prison admissions, which saw a larger proportion of serious crimes and a smaller proportion of drug and property offenses coming into prison, hearings before the Parole Board were made up of a greater proportion of more serious offenses. Parole hearings for sex offenses or violent offenses made up a greater share of the hearings held during the COVID-19 period than prior to the pandemic.46 This trend continued into 2021, with an increasing share of hearings for sex offenses or violent offenses and a lower share of drug offense cases coming before the Parole Board.
Parole grant rates remain consistent despite fewer hearings and a larger share of more serious offense types
Board data indicates that the decline in hearings and releases did not impact parole decisions. Despite a reduced number of hearings and higher proportion of serious cases coming before the Board, the discretionary parole grant rate remained consistent to pre-pandemic rates during COVID-19 at between 62 to 65 percent.47 The mandatory parole grant rates were comparable before and during COVID-19 (71 percent), but increased to nearly 79 percent over the first eight months of 2021.
The frequency of “no action” hearings increased during COVID-19
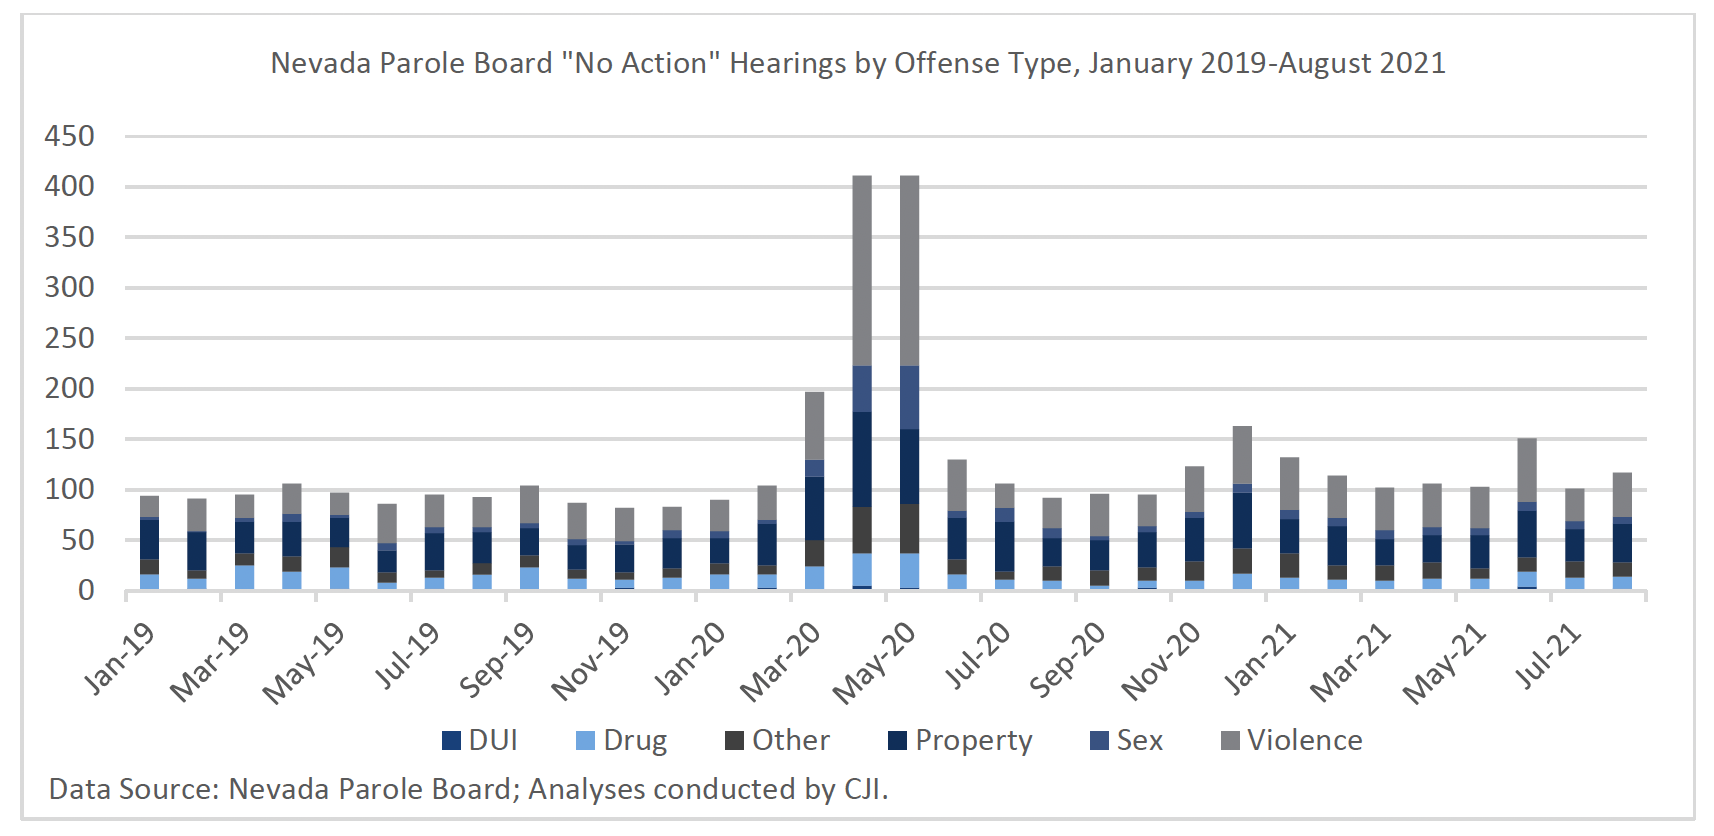
Among the decisions considered by the Parole Board is a “no action” hearing, meaning the Board took no action to deny or grant parole on an eligible case. Most often, the reasons listed for “no action” are administrative in nature but may include: requests for continuance by incarcerated people or their counsel; continuations pending the outcome of disciplinary or new criminal charges; or ineligibility due to “change or correction in sentence structure or credits earned/lost per NDOC records.” During the COVID-19 period when in-person hearings were suspended, “no action” was the primary decision for candidates who required an in-person hearing due to the nature of their case. As a result, during the COVID-19 period, “no action” hearings increased over 90 percent. The primary reason cited was “Public Meeting Canceled due to COVID-19 Emergency Declaration.” However, increased “no action” hearings also continued into 2021, despite the resumption of in-person hearings. Interviews suggest some of this inaction was in part to an inability to access individuals in custody who were either under quarantine or receiving medical care due to COVID-19. From January to August 2021, there were 24 percent more “no action” decisions than pre-COVID-19 (see Figure 12). “No action” hearings have the potential to result ina delay in the parole-eligible person’s release to parole and an extension of the period in prison. Well before COVID-19, the Board began considering contingency dates to allow for more timely hearings of “no action” cases for which administrative delays (e.g., missing paperwork) might be remedied within a month. In some instances, however, a contingency date is not possible, and the next hearing is delayed by another 60 to 90 days as a matter of course.48
Figure 12. “No action” hearings by offense type from January to August 2021
NDOC length of stay increased during the pandemic, with the median length of stay growing in both 2020 and 2021
While fewer individuals are entering prison during the pandemic, those in custody are staying there longer. The median length of stay for all individuals released from NDOC custody (14.4 months) was about one month longer for those released during COVID-19 than the median length of stay for those released during the pre-pandemic period (13.2 months). The median length of stay for individuals released from NDOC in 2021 was even longer (16 months), resulting in individuals remaining in NDOC custody nearly 1.5 more months than those released during COVID-19, and over 2.5 months longer than those released from NDOC pre-pandemic.49 Though the reason for the increased lengths of stay is not known, it could be caused by a combination of factors, including fewer monthly parole release hearings during COVID-19 and through 2021, an NDOC population with more serious convictions, and the inability to earn credits through programming or work placements.50
Nevada prisons had a higher death rate during the pandemic compared to other states
On March 26, 2020, NDOC announced the first employee case of COVID-19 on March 26, 2020,51 and the first positive COVID-19 case in an incarcerated individual on May 20, 2020.52 By March 2021, a year into the pandemic, NDOC had an estimated case rate of 399 per 1,000 individuals in custody, compared to the state’s general population case rate of 99 per 1,000 residents.53 Comparing transmission rates within states’ incarceration facilities, Nevada ranked 21st in the nation, similar to its ranking in community transmission. However, the Nevada prison system had the third-highest rate of deaths among incarcerated populations across 45 states, exceeded only by New Mexico and Kentucky, and significantly higher than its neighboring states (see Figure 13).54
Figure 13. Nevada prisons had far higher COVID-19 death rates per 1,000 individuals in custody than neighboring states
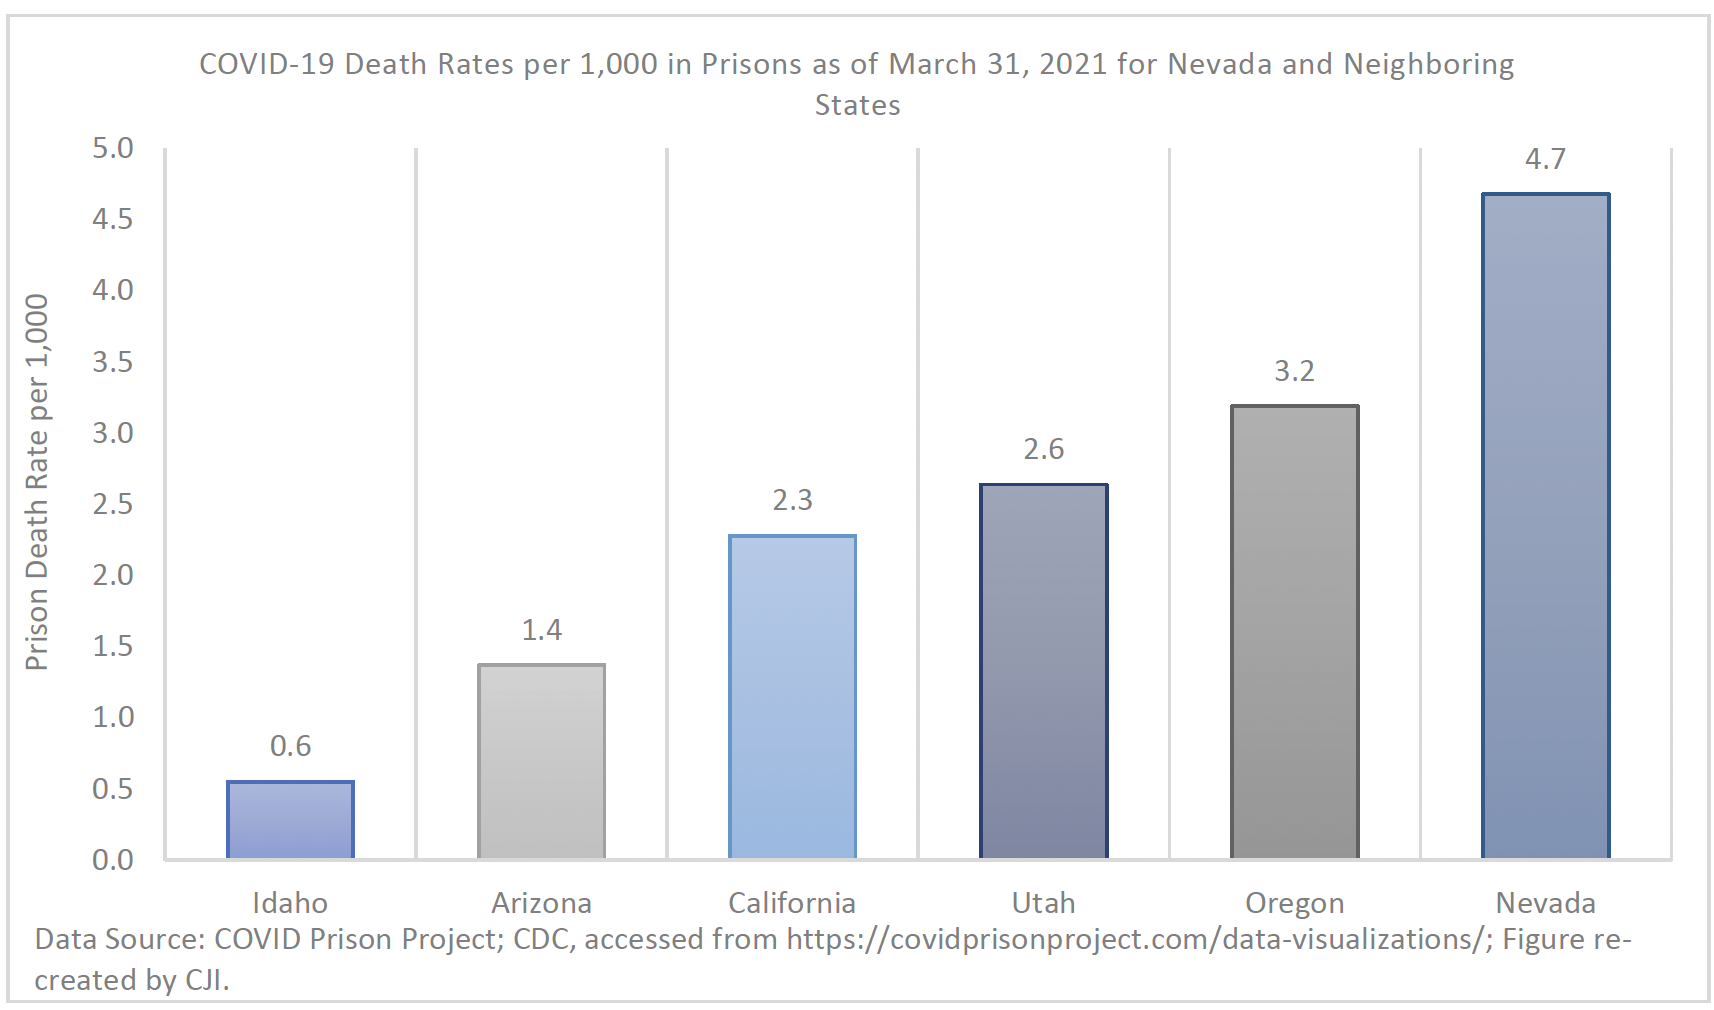
This finding is significant given the limited state action to reduce prison density and enable NDOC to engage in meaningful mitigation efforts. As noted earlier, despite tools being available to decrease the number of individuals in prison, releases decreased during the pandemic. This includes those mechanisms cited above, such as medical release, furlough, or residential confinement, as well as discretionary parole, mandatory parole, or geriatric parole. Geriatric parole was a new option for the Parole Board that went into effect in July 2020, yet the data showed zero hearings related to geriatric parole over the year following its effective date. Apart from existing mechanisms, the state took no executive action to release individuals from prison in contrast to some leaders across the country. This inaction is notable given the pressing need to reduce density to mitigate the spread and prevent harm to individuals within Nevada’s prison system.
NDOC data show increasing parole population during COVID-19 while surveyed NPP officers reported higher supervision caseloads 55
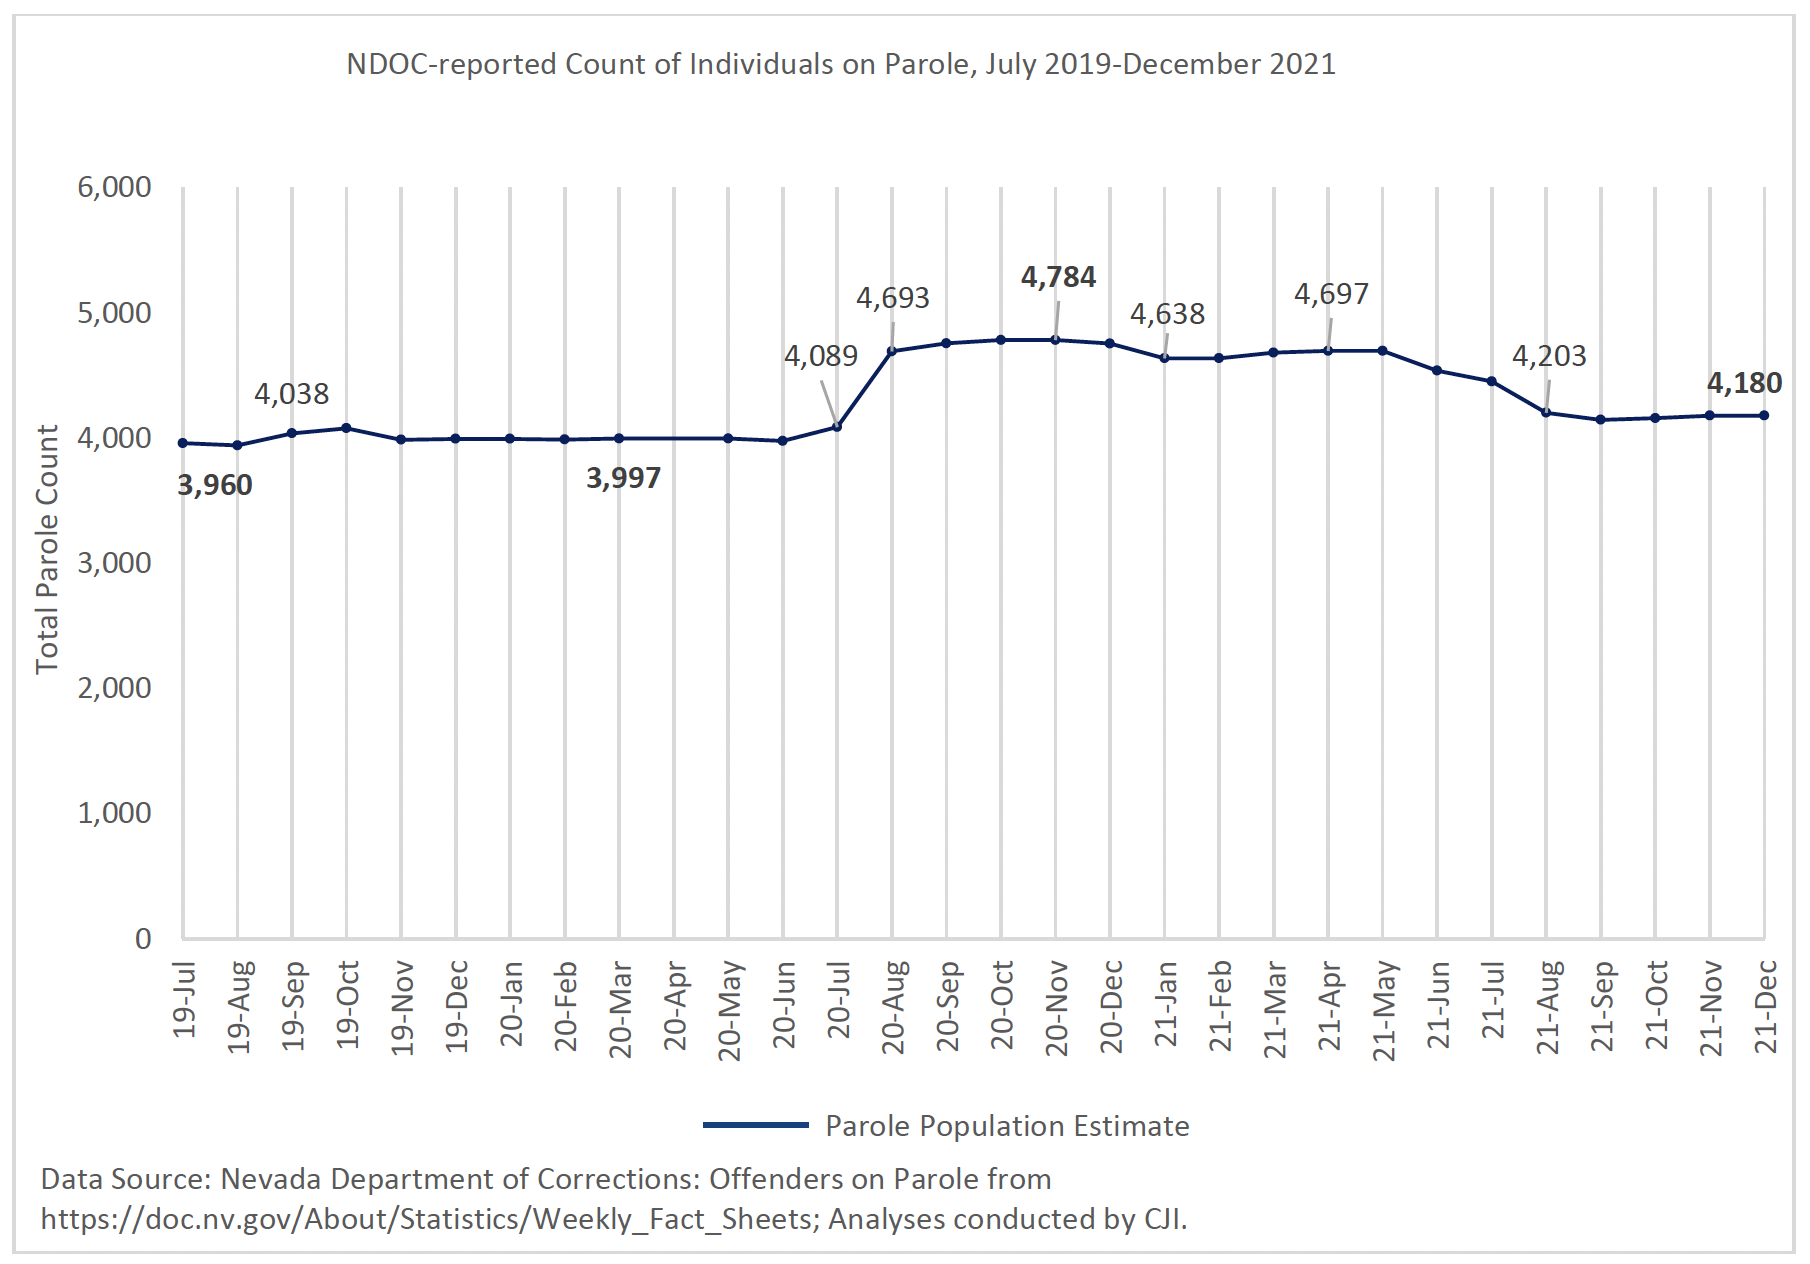
CJI also explored the impact of COVID-19 on Nevada’s community supervision population, using publicly available NDOC weekly reports that list counts of males and females on parole in Nevada on a given date. The data were pulled from the first available report each month from July 2019 through December 2021. Data showed a 20 percent rise in Nevada’s parole population from the onset of COVID-19 in March 2020, when there were just under 4,000 individuals on parole, to a peak in November 2020 at 4,784 people (see Figure 14). This increase corresponded with the increase in parole hearings between June and August 2020 (see Figure 11). Since November 2020, the parole population has gradually declined, with 4,180 individuals on parole by December 2021.
Figure 14. NDOC data show a 20 percent increase in parole population during COVID-19
CJI also surveyed NPP officers about changes in caseloads during COVID-19 compared to before the pandemic. While NDOC reports showed an influx in parole population during COVID-19, survey data indicated little change in caseload sizes. When asked to estimate their caseload sizes before and during COVID-19, officers reported slightly higher caseloads during COVID-19 (102 supervisees on average per officer) compared to pre-COVID-19 (92 supervisees on average per officer). By the fall of 2021, when the survey was administered, the per-officer caseload had returned to pre-COVID-19 numbers, at around 91 supervisees per officer.56
Endnotes
- Southern Nevada Health District. (2020, March 5). Southern Nevada Health District announces positive case of COVID-19 in a Clark County resident.
- Nevada coronavirus map and case count. (2022, February 28). The New York Times.
- nyt-covid-19-bot & Sun, A. (2022, February 28). Coronavirus (Covid-19) data in the United States.[csv file]
- Centers for Disease Control and Prevention. (2022, February 28). Trends in number of COVID-19 cases and deaths the US reported to CDC, by State/Territory.
- Centers for Disease Control and Prevention. (2022, February 26). New admissions of patients with confirmed COVID-19 per 100,000 population by age group, United States. Retrieved Dec 31, 2021.
- Centers for Disease Control and Prevention. (2022, February 28). Trends in number of COVID-19 cases and deaths the US reported to CDC, by State/Territory.
- Federal Bureau of Investigation. (2022, January). Crime Data Explorer.
- The phrase “serious offense” is used throughout this report. Because the measurement of crime seriousness may vary and can be subjective, for this report serious offense refers to person-based offenses, such as violent offenses, sex offenses, and other offenses against a person. This decision is informed by research on crime seriousness measurement, which typically finds that person-based offenses are rated as the most serious offenses (e.g., see de Giovanni, C., Shao, L., & Zhou. Z. (2021). How do people measure the seriousness of crime? British Journal of Criminology, Law & Justice 1(1), 39-51.)
- Felony offense categories pre-defined and grouped by Eighth Judicial District are as follows: Person, Property, Drug, Sex, Traffic, and ‘Other’. Felony ‘other’ category included a large portion of weapons-related offenses.
- Felony ‘person’ category using NV AOC data includes: crimes against persons; domestic violence; elder abuse; and child abuse & neglect. Felony ‘other’ category using NV AOC data includes: weapons; public order; motor vehicle – DUI, reckless, other; and AOC-defined ‘other’.
- A similar pattern was observed for District Courts’ ‘other’ offense category, which dropped 19 percent in case filings during COVID-19 but dispositions for this offense type dropped even further at 26 percent.
- Offense categories pre-defined and grouped by NDOC: Violence, Sex, Property, Drug, DUI, and Other. Further exploration into the “other” category shows over one-third related to weapon or firearm possession.
- Violations without new convictions may be technical violations or other violations that are not new crimes, like absconding; however, the data do not allow for analyses at that level of detail.
- A note on parole violations: between March and July 2020, the Parole Board and Division of Parole and Probation quashed warrants for parolees deemed to be “low-level violators,” resulting in fewer returns to prison of parolees than otherwise might have occurred during that period.
- Because jail stays are often less than one month long, the summer 2020 decline in jail releases was certainly driven to some degree by the decline in admissions during that period.
- These NDOC release patterns during COVID-19 align with uptick in parole hearings around late Summer 2020 (see Figure 11).
- While release numbers can be expected to fluctuate with changing prison population sizes, the rate of decline in release patterns was greater in 2020 and 2021 than the rate of decline in NDOC population. The 2020 and 2021 NDOC end-of-year populations were down 11 and 10 percent, respectively, while the end-of-year release numbers were down by 15 and 12 percent those same years.
- NRS § 209.3925.
- 41 NRS § 209.3925.1 (a) (2); DOC Regulation 523.04, § 2 (B).
- 42 NRS § 209.501.
- 43 NRS § 213.133 (8).
- Id.
- Regarding the specific number of hearings, the Parole Board held over 1,100 fewer hearings in 2020 (5,786) than in 2019 (6,903).
- Parole board data pre-defines offense categories as DUI, Drug, Property, Sex, Violence and “Other.”
- The grant rate during COVID-19 excluded the April and May 2020 “perfect” 100 percent grant rates that resulted from the Boards granting of parole to select eligible inmates without a hearing. When those months are included, the average monthly discretionary parole grant rate was 65 percent, slightly higher than the rate of 62 percent excluding the two months and comparable to the rate before COVID-19. Mandatory grant rates including all of the 10 months during COVID-19 were 75 percent.
- NRS 213.010; NRS 131.
- The reported length of stay estimates reflect all releases and include shorter stays for individuals incarcerated for parole or probation violations. The median lengths of stay for new commitments-only showed similar patterns, with stays around 21 months before COVID-19, 22 months for releases during COVID-19, and about 24 months for releases over 2021.
- Lyle, M. (2021, March). Corrections Dept. rule has extended prisoners’ sentences during pandemic: Lawmakers urged to retroactively fix NDOC good time credits policy. Nevada Current.
- Nevada Department of Corrections. (2020, March 26). Nevada Department of Corrections confirms first case of COVID-19 [Press release].
- Nevada Department of Corrections. (2020, May 20). NDOC confirms first offender case of COVID-19 [Press release].
- The COVID Prison Project. (2021, March 31). COVID-19 Cases per 1,000 in the Prison and the General Population as of March 31, 2021.
- The prison death rate reported for Nevada was of 4.68 per 1,000. Source: The COVID Prison Project & The University of North Carolina. (2021, March 31). COVID-19 Deaths per 100,000 in the Prison and the General Population as of March 31, 2021. These rates were calculated using publicly-reported data from state agencies. The rate published for Nevada is 468.40 deaths per 100,000 inmates, giving Nevada the third-highest COVID corrections death rate in the country, behind Kentucky and New Mexico. This rate was calculated using 53 COVID deaths within the NDOC population as of March 31, 2021, a number consistent with dashboard data from the Nevada Department of Health and Human Services through the same period. The NDOC population number was taken from a weekly NDOC fact sheet indicating that as of February 2, 2021, NDOC’s total population was 11,315. This ranking is comparable with data reported by the Marshall Project and the Associated Press, which indicated that Nevada had the highest COVID corrections death rate in the country during a similar period.
- While NPP officers supervise individuals on both parole and probation, reliable information on the count of individuals on probation in Nevada at any given time was not accessible to CJI. Estimates of Nevada’s parole population were obtained using NDOC reports, while NPP officer survey responses refer to officers’ observations of caseloads that include both types of community supervision: probation and parole.
- Officer responses varied considerably depending on supervision type. During COVID-19, officers assigned to low-risk supervision (LRSU) reported as few as 120 supervisees while officers assigned to intensive or high-risk supervision reported as few as 30 supervisees.
This project was supported by Grant No. 2015-ZB-BX-K002 awarded by the Bureau of Justice Assistance. The Bureau of Justice Assistance is a component of the Department of Justice’s Office of Justice Programs, which also includes the Bureau of Justice Statistics, the National Institute of Justice, the Office of Juvenile Justice and Delinquency Prevention, the Office for Victims of Crime, and the SMART Office. Points of view or opinions in this document are those of the author and do not necessarily represent the official position or policies of the U.S. Department of Justice.
The Crime and Justice Institute (CJI), a division of Community Resources for Justice, works to improve public safety and the delivery of justice by providing nonpartisan technical assistance, research, and other services to improve outcomes across the spectrum of the adult and juvenile justice systems, from policing and pretrial through reentry. CJI provides direct technical assistance, assessment, implementation, research, data analysis, training, facilitation, and more. We take pride in our ability to improve evidence-based practices in public safety agencies and gain organizational acceptance of those practices. We create realistic implementation plans, put them into practice, and evaluate their effectiveness to enhance the sustainability of policies, practices, and interventions. Find out more at www.crj.org/cji.